Why the “traditional” way of KPI tracking is not an option (any more).
As a marketer, you are interested in how various marketing KPIs and metrics evolve over time. In theory, you should concentrate on 2 or 3 main marketing KPIs which you can track regularly and then adjust your marketing tactics based on that. However, in practice, the amount of marketing KPIs and metrics can be massive. In addition, they can change over time based on your focus and priorities. It is very hard for a marketer to keep an overview of what’s going on with hundreds of KPIs at hand and execute the KPI tracking in an effective way.
Nevertheless, with the unlimited access to marketing data and the latest technological advancements, it is becoming more and more tempting to steer marketing business and draw conclusions based on data rather than subjective expert judgement. So how not to get lost in this digital ocean and make the data-driven conclusions smartly when it comes to KPI tracking?
One aspect of such a marketing data-driven approach is to detect the abnormal behaviours of your important metrics, recognize and understand unusual and surprising patterns. Detecting these patterns (aka anomalies) might bring you interesting insights like whether the performance of your ongoing campaign is unexpectedly good (or bad) or may point out to completely new market circumstances, which are impacting your business (e.g. economic downturn), but which you could not anticipate before. This makes the process of KPIs tracking and anomalies detection especially important in situations where urgent action is required from the marketer.

You may ask yourself if it is really needed. Of course, you can monitor these metrics manually by looking at dashboards and visually checking each one of them. However, this method of marketing KPIs tracking has its clear drawbacks:
1. First of all, it is very time-consuming.
2. Second of all, it is tiring and can be really annoying and error-prone – especially if you do it every day.
3. It doesn’t allow you to scale – it is physically impossible to monitor all metrics when there are that many.
4. Less energy left for creative work.
5. When you find an anomaly, it might be already too late to take action.
6. Last but not least, it is very expensive to do this on a regular basis.
As a result, the process of tracking KPIs is not used frequently and many marketers skip certain steps or leave it out completely. Missing the important anomalies can lead to increased business costs and lost opportunities and directly have an impact on your ROI.
Monitoring your marketing KPIs at scale
Nowadays, the process of marketing KPI tracking can be automated with the help of artificial intelligence. AI technologies can make it way faster and more effective. However, before implementing AI technologies make sure that your data is prepared for integration.
Once you have your data at disposal and ready for AI to be applied, you can benefit from the newest algorithms and move from manual tracking to large scale monitoring systems including anomaly detection. These algorithms will detect the anomalies of time-based KPIs and will automatically notify you in case of any findings.
There are three general types of anomalies: outliers sustained increases or variance changes.
Now, let’s have a deeper look at these common anomaly types.
For a better understanding, we have provided a simple illustration for each anomaly type.
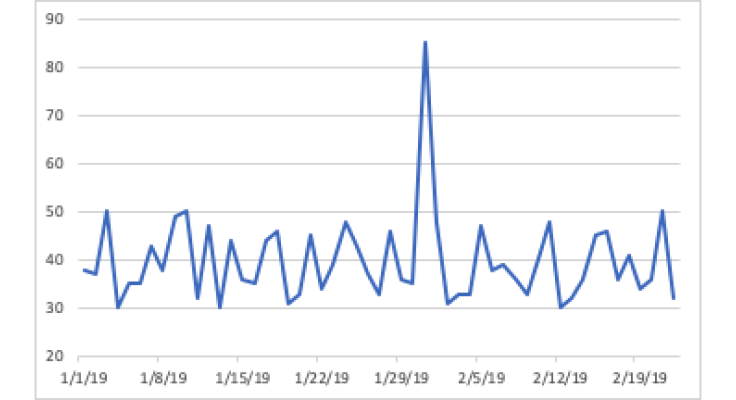
1. Outlier
You can easily identify outliers by looking at the graph below. Those are the data points that differ significantly from the main population. It is an abnormal observation that lies far away from other values.
As an example, these could be conversions you have made after holding an important event, or an influx of visitors on your website after making an important announcement at the press on social media. The higher value is only short-lived, but may be of crucial importance to you. The outlier can also be negative, such as a sudden drop in revenue of your main product.
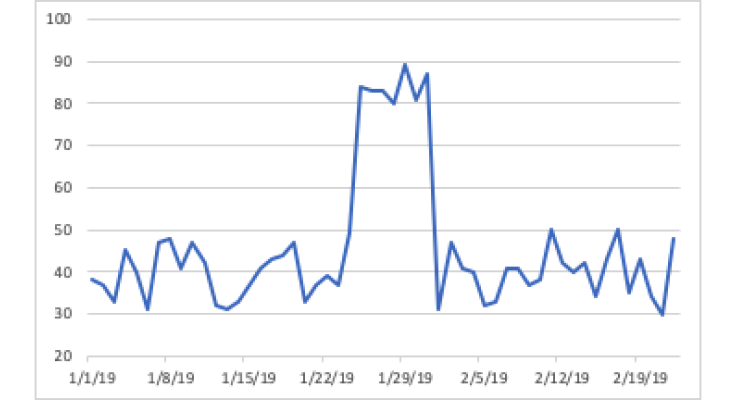
2. Sustained increase
Here, we can see an example of a sustained increase. Basically, it signifies an abnormal behaviour that lasted for a certain period.
It might represent both the sustainable upward and downward trends.
As a marketing example, we can think about a heat wave which subsequently causes a spike in the sales of ice-cream during that time. Another example is, if you have a problem with your website for a certain period, the amount of bounces might resemble that.
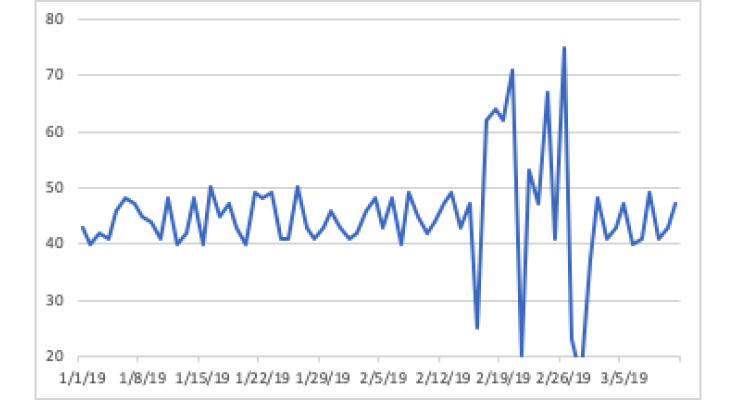
3. Variance change
Variance change represents an unsustainable fluctuation; a significant decrease and increase in the metric’s value. One can say that it is a very fast-changing behaviour of the number. As an example, this can happen when you sell globally and suddenly the foreign-currency starts to fluctuate heavily, which in turn has a direct impact on the sales revenue in your local currency.
How exactly does it work?
Basically an anomaly detection algorithm searches the patterns in the past of the selected metric or checks the behaviour of other highly related metrics and verifies if the observed numbers/data points are different than expected by the algorithm. If the discrepancy between rel data and models calculation is high, then an anomaly is detected. Usually such algorithms reveal abnormal behaviours fast and way more consistently than a team of marketers does.
It is important to note that anomalies can detect positive and negative effects impacting your business. For example, the success of specific marketing actions might be represented by a spike in conversions (then the discovered anomaly is a positive effect), whereas having a problem with your e-commerce platform might be recognized by a big drop in sessions (then anomaly indicates a negative effect).
Algorithms characteristics can vary depending on what your KPI is. For example, at Nexoya, machine learning and statistical models are specialized in anomaly detection on time series data. Nexoya’s algorithms are built in a way that they account for trends and seasonality, as well as for holidays and special events.
We hope this helps you to start using modern AI approaches for the monitoring of your KPIs!
If you are curious to find out how modern KPI and marketing campaign monitoring works in practice, check out our case study with Generali.
Read more about: the importance of Integrated Marketing Strategy, and the process of AI model creation.