Do you run multiple paid campaigns across Google Ads, Facebook, Instagram and Linkedin?
If so, then you know it’s hard to compare the data easily and have a good overview of what’s going on where. Which channel has the better CPM, what campaign works best etc.
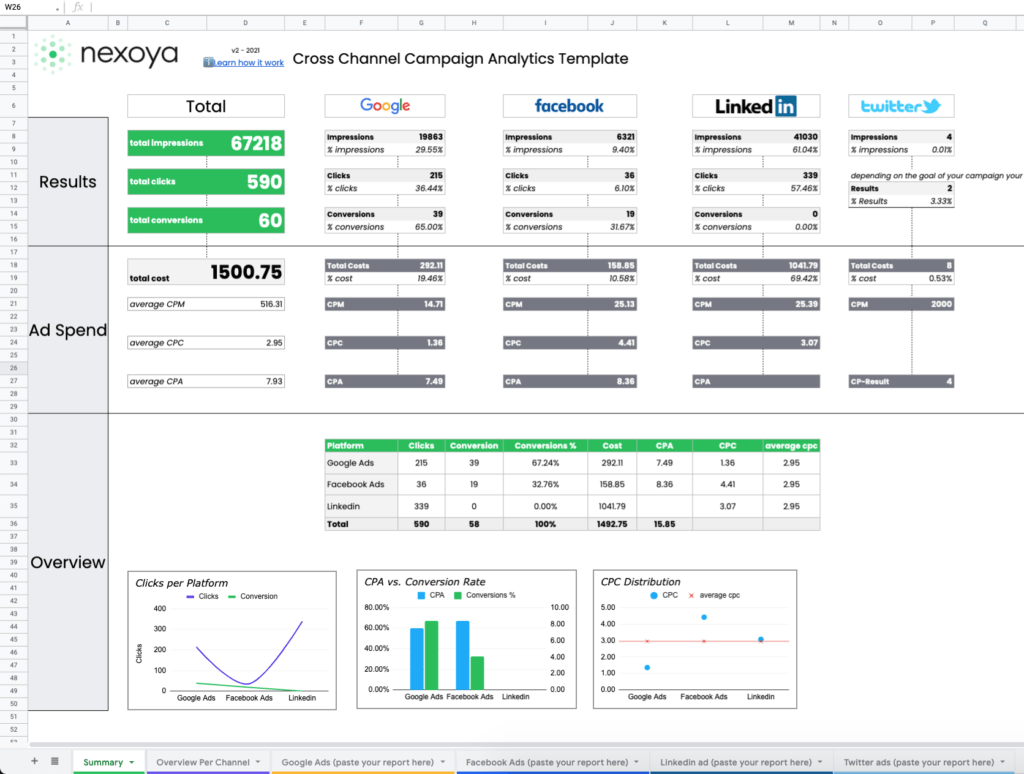
We know how hard this is and especially when you start with campaigning – it is hard. To give you a taste of what it is like to become more data-driven, we created an Excel Template so that you can easily compare your paid campaigns.
Request the free Excel Template and the instructions to use it effectively and find out how easy it is to apply more data to your decision process.
And to make sure that you get the most out of this template, we wrote some short instructions on how to use it most effectively. Follow these simple instructions down below and you will see how you can integrate data into your every day life.
How to use the template
Google Data
- Open Google Ads
- Click on the Reports Button in the top bar
- Go to > Predefined Reports (Dimensions) > Basic > Campaign Details
- Select your desired time period on the top right of the screen
- Click the Download Button on the top right of the screen and export it as an Excel.csv file
- Press Cmd + A on MAC or CTRL + A on Windows to mark all cells. Copy them and paste them in the Google Folder in the nexoya Free Analytics Template.
Facebook Data
- Open Facebook Ads Manager
- Click on the Campaigns Folder View on the top left (it should be open by default anyways)
- Select your desired time period on the right of the screen
- Click on the Reports Button to the right of the screen
- Click Export table data…
- Click Export as .xls (Make sure to neither “Include deleted items with delivery” nor “Include summary row”)
- Download the report
- Press Cmd + A on MAC or CTRL + A on Windows to mark all cells. Copy them and paste them in the Facebook Folder in the nexoya Free Analytics Template.
LinkedIn Data
- Open LinkedIn Campaign Manager
- Choose your Account and click on the Campaign Folder View in the top bar in the middle
- Select your desired time period on the right of the screen
- Click the blue Export button on the far right
- Choose Campaign Performance as a report type
- Choose All as time breakdown
- Export/Download the Report
- Press Cmd + A on MAC or CTRL + A on Windows to mark all cells. Copy them and paste them in the LinkedIn Folder in the nexoya Free Analytics Template.
Twitter Data
- Open Twitter Ads Manager
- Click on Add a filter on the top left and select Objective, Status, and Campaign Name
- Select your desired time period on the right of the screen
- Click on the Metrics button to the right of the screen and select website conversions
- Make sure the Breakdown button is marked as none.
- Click Export as .xls
- Download the report
- Press Cmd + A on MAC or CTRL + A on Windows to mark all cells. Copy them and paste them in the Twitter Folder in the nexoya Free Analytics Template.