Tips and Tricks to running a successful A/B test
Conducting field experiments is not as easy as it might sound. Based on the experience of an extensive study that has been conducted over 8 months with the University of Zurich, the most important insights are summarized below. This study was part of a larger research project at UZH.
In today’s diverse, complex, and fast-paced digital marketing landscape, it can be a huge challenge to understand exactly what kind of impact your marketing campaigns are having on your results.
Did sales increase because of that new display campaign you just launched, or was it because the campaign launch just happened to coincide with some other factor—say, a seasonal event like Easter, or using 2020 as an example, a pandemic related lockdown just kicked in.
Of course, with experience comes knowledge, so you can probably recognize how various marketing channels and outside factors interact, but what if you’re testing a new marketing solution, or using a new, innovative technology?
That’s when A/B tests come in. They’re a staple of a marketer’s toolkit, and an excellent way to understand what kind of impact a particular part of your marketing activity is actually having on your bottom line – and it gives confidence that the observed effects are not due to chance.
For nexoya’s collaboration with the University of Zurich, this is exactly what we did.
For her Master’s thesis, Flavia Wagner wanted to understand how leveraging AI compared to marketing experts impacted marketing results. As it happened, nexoya was the perfect solution to put to the test: we use AI to optimize cross-channel marketing budgets to provide the ideal allocation of spend for the best, most cost-efficient performance possible on a dynamic, rolling basis.
Wagner’s hypothesis was simple: does AI-based optimisation perform better than marketing budgets optimized by a marketing expert?
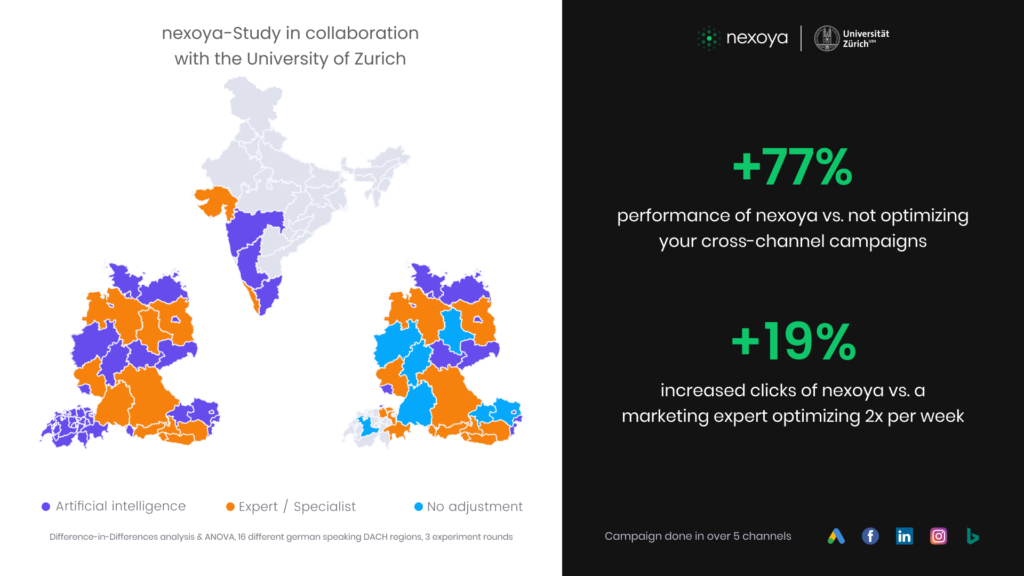
As this experiment was for a Master’s thesis which would undergo stringent review, it was extremely important that the results would stand up to statistical scrutiny. The golden standard are randomized field experiments that deliver reliable and generalizable estimates of the effect. Applying multiple statistical analyses to the data gathered over half a year, Wagner was able to conclude that nexoya’s AI-driven budget optimisation delivered 19% more clicks than the marketing expert, and 77% more clicks than the control group.
Thanks to the A/B test, we were able to conclusively prove what kind of impact our marketing tool had on campaign results.
So without further ado, below are our tips and tricks for setting up your A/B test:
Include a control group
- Having a baseline of activity during which no changes are made means you can ensure that there’s no outside factors skewing the results in one of the test groups and not the other. In each of our two experiment rounds, we had our campaigns run for 7 days with no changes made before we began optimising. We also had a control group running the entire time in the second experiment, to see how both nexoya and the expert would stack up against a marketing campaign with no budget optimisations. This allows for a straight forward difference-in-difference analysis of the results.
Be meticulous in how you split your test groups
- There’s many different ways in which you can split the test groups, but it’s key that you take into consideration any factors that can influence the groups and control for them. Furthermore, it is important that there is no interaction or overlap between the groups. In the nexoya x UZH experiments, groups were split into geographic regions. To ensure audience size and interests were as equal as possible across the geo blocks, we drew up the blocks based on factors such as population, GDP, audience interest (e.g. number of tech companies relevant to our product), and search volumes.
Have enough statistical power
- To ensure that the results are statistically sound, having enough power is very important. Our A/B test was conducted in four separate geo blocks, where budgets were optimized as an individual campaign, in essence giving us 4 groups per treatment. This allowed us to increase the power to achieve statistically significant results. General rule is, the more data the better.
Control for as many factors as possible during setup
- This one may seem fairly obvious, but when you’re running multiple campaigns on multiple channels, sometimes things slip under the radar. It’s vital that if you make a change to one campaign in group A (such as the audience segment being targeted), that the same change is replicated in group B. Otherwise, it’s extremely difficult to say that, for example, the budget optimisation was the reason for one group performing better than the other. When you control for that very carefully, it’s a lot clearer what actually impacts performance.
Use appropriate statistical models
- Marketers often look at the results of an A/B test in their raw format (i.e. group A saw 400 conversions and group B saw 500, thus group B performed better), but running a statistical analysis on the test will give you much more solid results. As such, it’s important you choose the right models to use for your analysis. In our case, we used Difference-in-Differences and ANOVA to analyze the results. Including additional factors in the analysis such as money spent, day-of-the-week, and regional fixed effects further enhance the accuracy of the results.
A/B testing is ultimately a very powerful yet relatively straightforward way to find out how your various marketing efforts actually impact your results.
In our case, we were able to conclude that yes, AI based budget optimisation performed better than the same optimisation performed by a marketing expert—specifically, 19% better.
Special thanks to Flavia Wagner and Dr. Markus Meierer from the University of Zurich for this collaboration.