As a marketing analytics startup, we are always interested in how people use their marketing software: the trending tools, the key users’ expectations, or the big changes in the market.
In spring 2020, when more and more people approached us and asked what alternatives to Google Analytics we know, we decided to take the chance and explore this trend in the usage of Web analytics software more deeply.
With the help of Lucerne University of Applied Science and Art, we conducted research to reveal the primary users’ expectations from their Web Analytics software.
We asked 487 people how satisfied they are with their current software and discovered their key expectations and must-have features.
Six months later, we decided to publish our main findings and share them with you!
As a result of the collaborative teamwork, our Web analytics report went live at the beginning of this year!
It was indeed a great experience, and now we are happy to share some exciting facts about this journey!
10 facts about Web analytics report creation
Eager to see the results?
Get your free Web analytics report now!
Text version of the infographic:
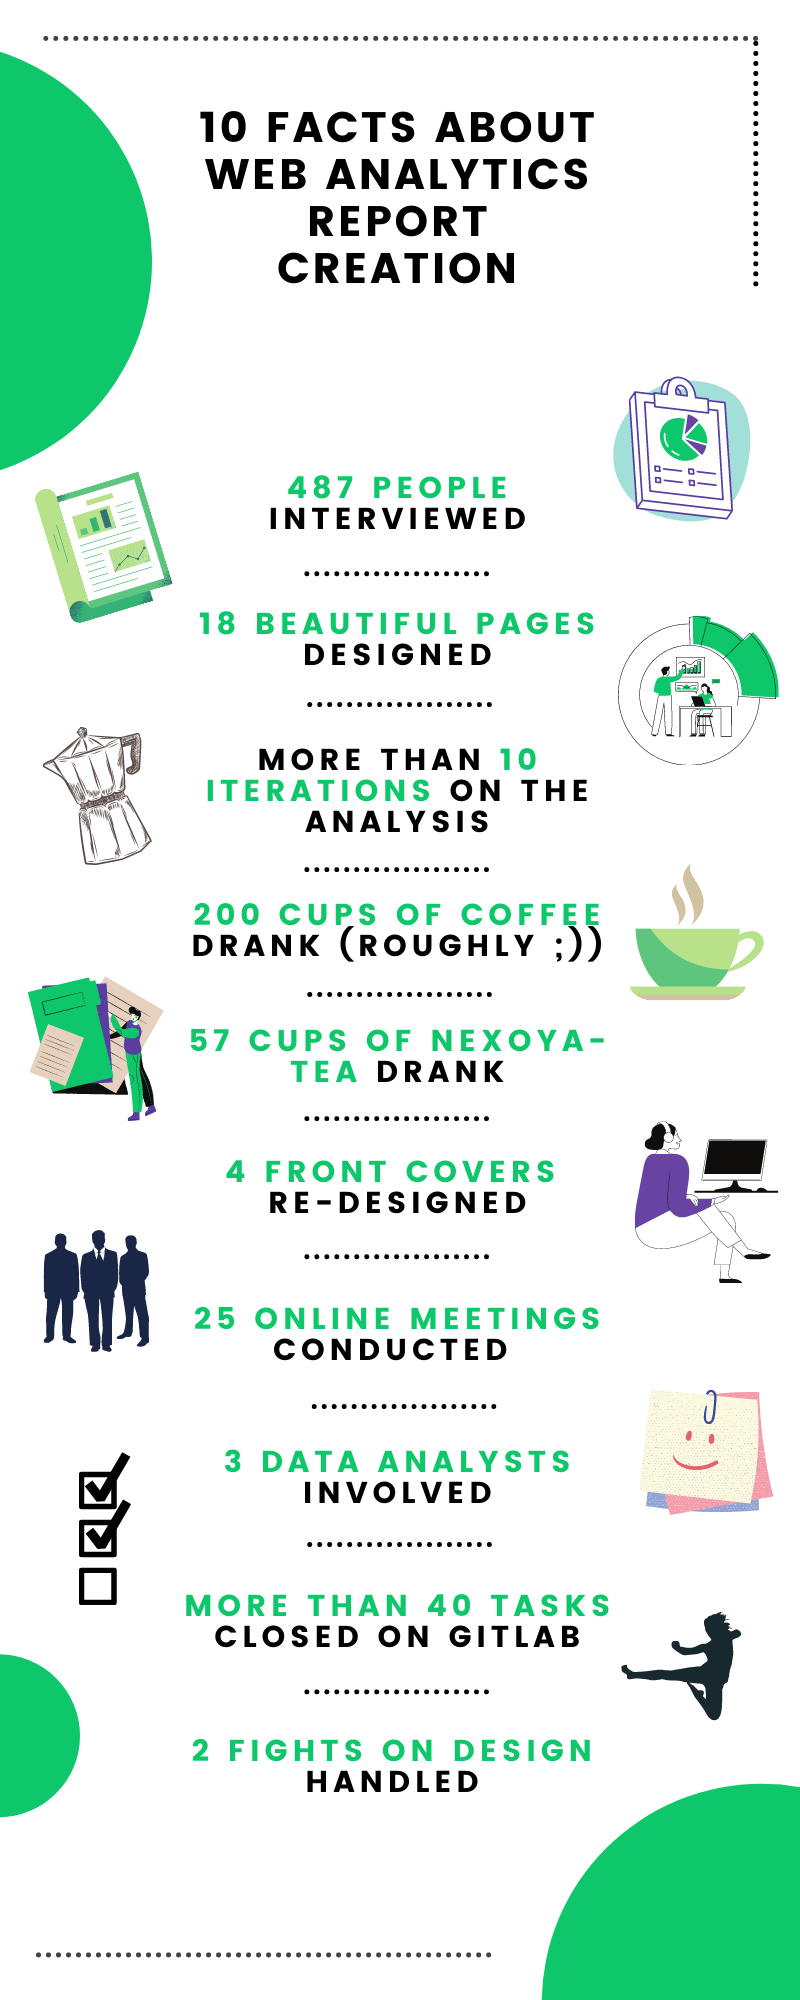
10 facts about Web analytics report creation
- 487 people interviewed
- 18 beautiful pages designed
- More than 10 iterations on the analysis
- 200 cups of coffee drank (roughly ;))
- 57 cups of nexoya-tea drank
- 4 front covers re-designed
- 25 online meetings conducted
- 3 data analysts involved
- More than 40 tasks closed on GitLab
- 2 fights on design handled