We all know how vital it is for any business to regularly track its Key Performance Indicators. In our previous articles, we talked about the five most important marketing KPIs and common mistakes most marketers make when tracking KPIs. But until today, we did not touch upon the topic of the actual result and how it compares to others: what KPI value can be considered good for your business? What are the marketing benchmarks for your industry?
In this article, we prepared a compilation of the 7 top Marketing KPI benchmarks that can help you estimate the average KPIs for your industry!
Let’s dive into it!
Structure:
- Website Conversion rate
- Website Bounce rate
- Google Ads benchmarks
- Bing Ads/Microsoft Advertising benchmarks
- Email marketing
- Facebook Ads benchmarks
- Net promoter score (NPS)
Marketing KPI benchmarks by industry
Website Conversion rate
What is a good conversion rate for your business?
It comes as no surprise that the website that sells coffee beans will have a higher conversion rate than the website that provides professional real estate services or is in the B2B space. As a result, the same value can be a tremendous achievement for one business and a complete disaster for another.
Therefore, it is crucial to know the average conversion rate for your industry when setting up your marketing strategy goals.
So, what is the industry benchmark for conversion rate?
Unbounce developed an insightful Conversion benchmark report that provides an average Website Conversion Rate benchmark for each industry. This marketing benchmark report is based on the vast dataset derived from 34 thousand landing pages and 19 million conversions in 2020.
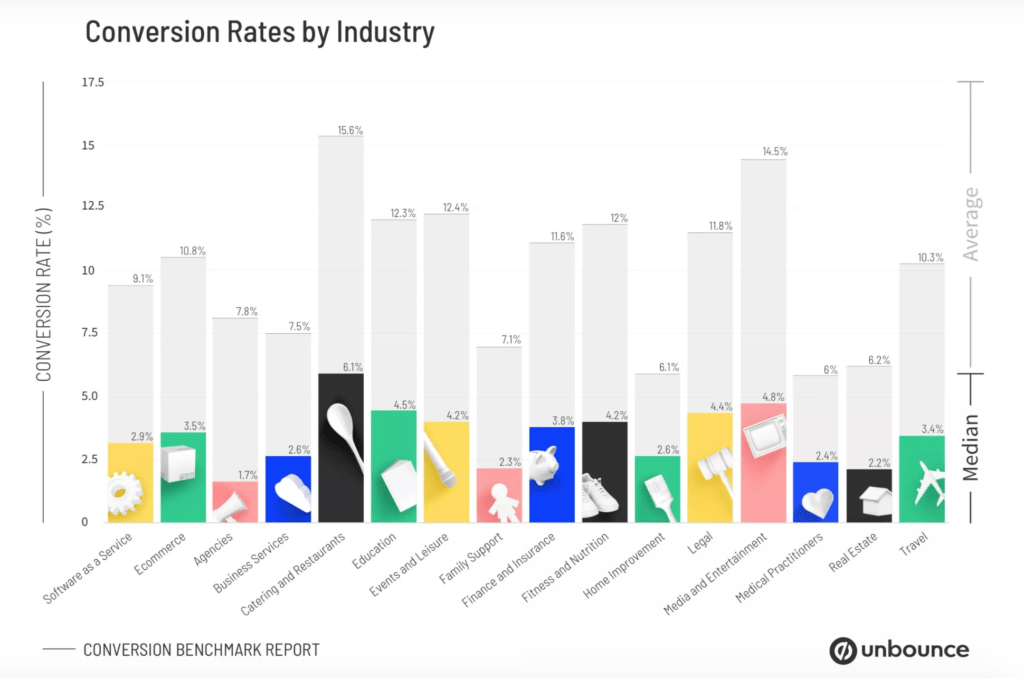
Highlights:
Top five Industries with the highest website conversion rate:
- Catering and Restaurants (6.1%)
- Media and Entertainment (4.8%)
- Education (4.5%)
- Legal (4.4%)
- Events and Leisure, Fitness and Nutrition (4.2%)
According to this industry benchmark report, the Food, Media, Education, and Legal industries have the highest median conversion rate above 4.4%. While Agencies and Real estate industries have the lowest average conversion rate values: 1.7 and 2.2.%, respectively.
Software as a service (SaaS) companies have a relatively low conversion rate of around 2.9%.
As a result, we can conclude that the companies that provide more complex products or services, on average, have a lower conversion rate.
Website Bounce rate
The website Bounce rate is another important indicator of your website’s health. By tracking the average bounce rate, you get more insights into your user behavior and your website’s overall effectiveness.
But what bounce rate can be considered normal for your industry?
Orbitmedia shares statistics on the average bounce rate benchmarks by industry. This report is based on the dataset derived from more than 250M website visits in 2020. US-based companies represent 95% of the sample.
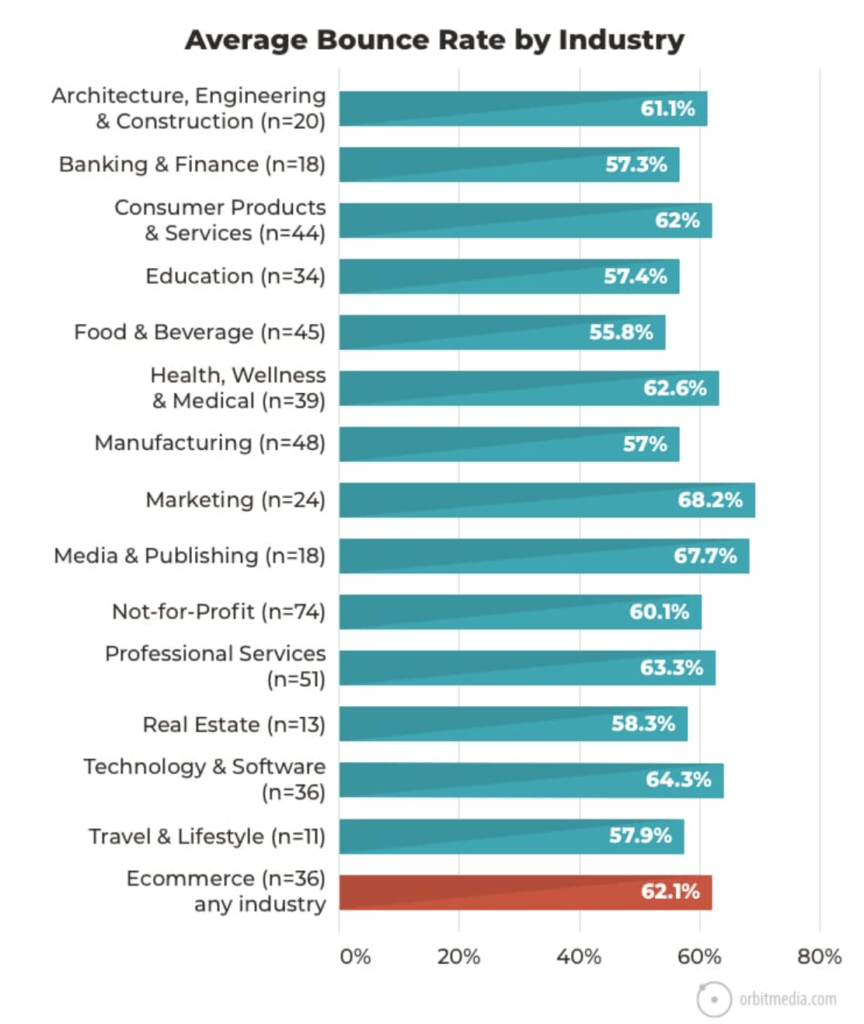
Highlights:
Top five Industries with the best aka lowest Bounce rate:
- Food and Beverage (55.8%)
- Manufacturing (57%)
- Banking and Finance (57.3%)
- Education (57.4%)
- Travel and Lifestyle (57.9%)
As we can see, the Marketing and Media industries, on average, have the highest bounce rate above 67%. Whereas Food and Manufacturing industries have the lowest average bounce rate below 57%.
According to the industry benchmark report, the average bounce rate for all the industries falls within the range between 55 and 68%. A higher bounce rate might signify that the website needs improvement.
It is important to keep in mind that Bounce rate can also vary significantly depending on the region. As noticed before, the report mainly represents the statistics for US-based companies.
Google Ads benchmarks
Do you use Google Ads for running your marketing campaigns? Have you ever compared your result to the industry benchmarks?
Isn’t it fascinating to see how your company is doing compared to your competitors?
Indeed it is!
Wordstream provides an insightful overview of the Google Ads statistics for both Display and Search ads. This report is based on the dataset derived from 14,197 US-based companies in 2018.
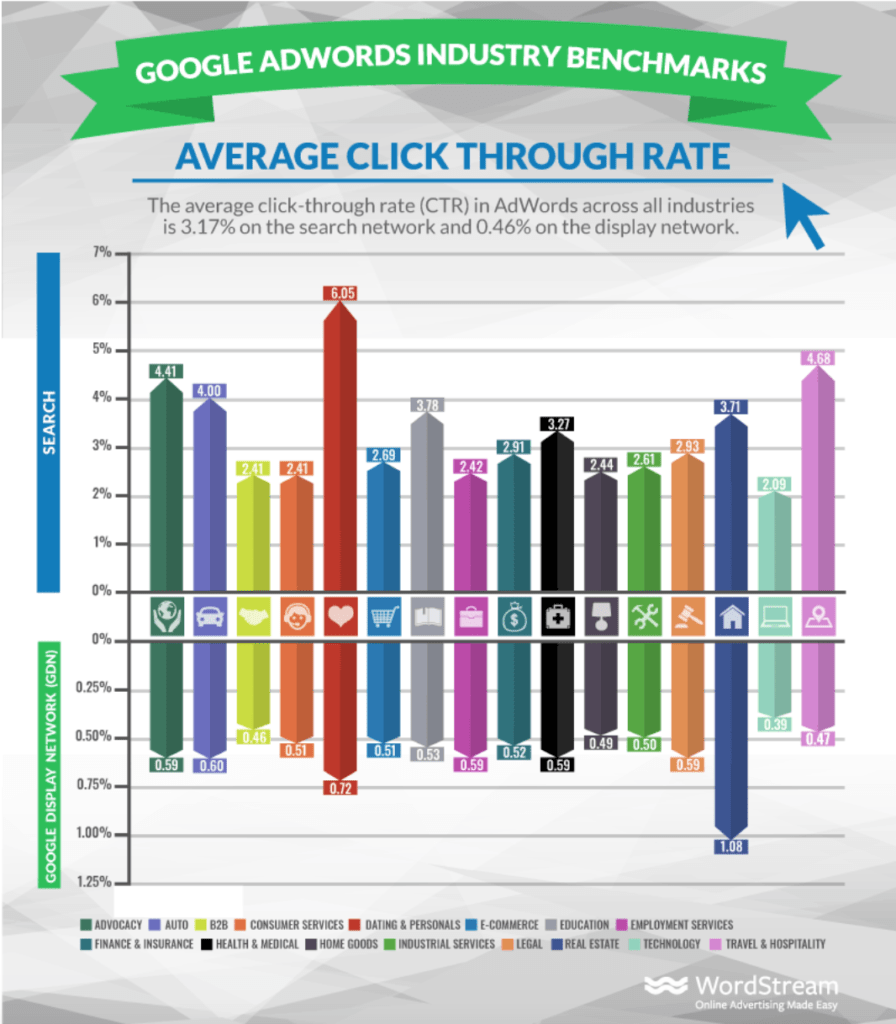
Highlights:
Top five Industries with the highest CTR on Google Search ads:
- Dating and Personals (6.05%)
- Travel and Hospitality (4.68%)
- Advocacy (4.41%)
- Auto (4%)
- Education (3.78%)
Top five Industries with the highest CTR on Google Display ads:
- Real Estate (1.08%)
- Dating and Personals (0.72%)
- Auto (0.6%)
- Advocacy, Employment services, Health and Medical, Legal (0.59%)
- Education (0.53%)
As we can notice, when it comes to the Search ads, amongst the top industries with the highest Click-through-rate (CTR) are Dating and Personal services (6.05%), followed by Travel and Hospitality (4.68%), Advocacy (4.41%), Auto (4.0%). Whereas companies operating in the Technology, B2B, and Consumer service industries have an average CTR of around 2%.
As for the display ads, we can notice that this type, in general, has a lower CTR. As a highlight, according to Google Ads benchmark report, the Real Estate industry has the highest CTR in Display of about 1.08%. At the same time, other industries, on average, have a CTR lower than 1%.
This industry benchmark report also provides information about the average cost per click, conversion rate, and cost per action for both Search and Display ads. As regards costs, it is crucial to understand that such factors vary significantly depending on the location or the targeting focus of your ads.
Bing Ads/Microsoft Advertising benchmarks
Wondering about advertising on Bing (Microsoft Advertising)?
Today many companies overlook this channel, assuming it is not that popular amongst their potential clients. But recently this changed, more and more customer of nexoya are also looking at Bing. Although Google remains an undisputable global leader, statistics show that Bing is steadily gaining market share. And many companies are starting to benefit from placing their advertising there.
Believe it or not, but for some industries advertising on Bing might be much more beneficial than on Google.
So, what about marketing benchmarks on Bing ads?
The Bing ads benchmark report from Wordstream provides up-to-date statistics on the KPIs benchmarks by industry. This report is based on the dataset derived from 1,242 US-based companies in 2017.
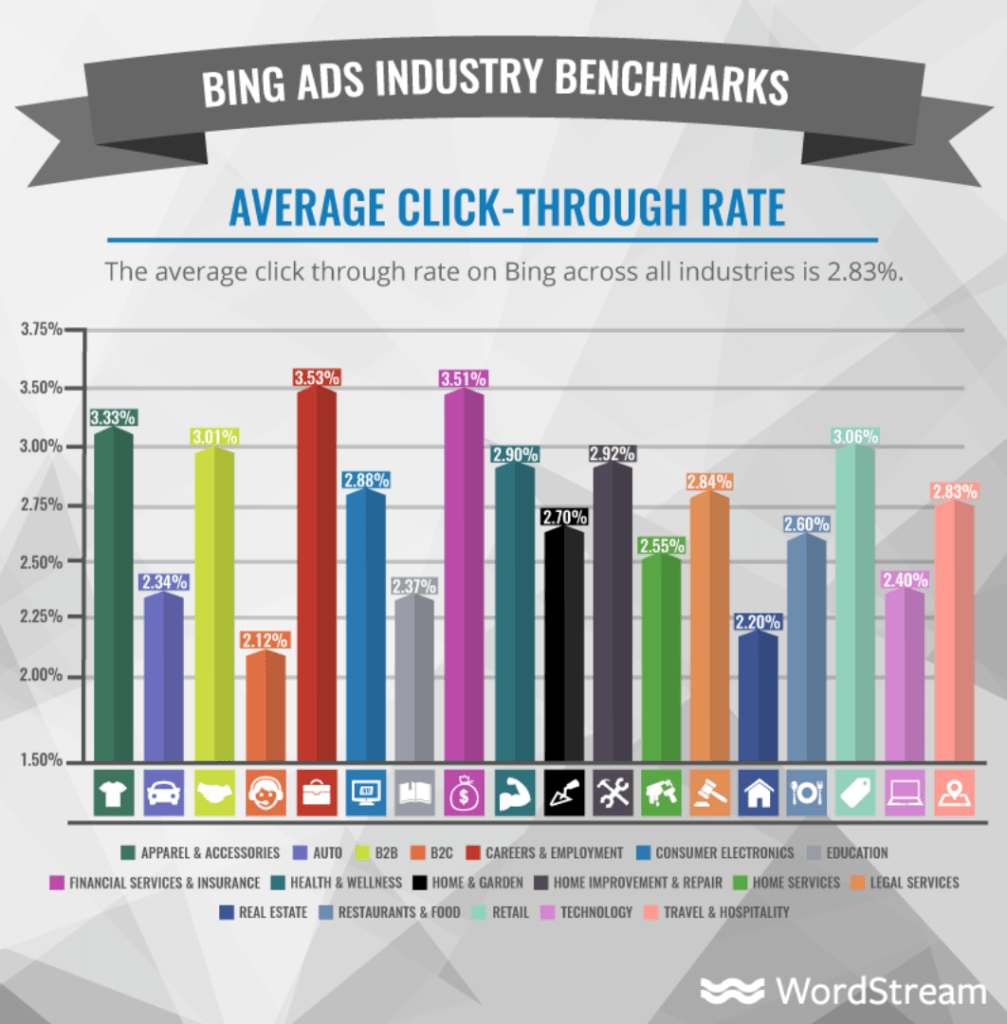
Highlights:
Top five Industries with the highest CTR on Bing:
- Careers and Employment (3.53%)
- Financial Services and Insurance (3.51%)
- Apparel and Accessories (3.33%)
- Retail (3.06%)
- B2B (3.01%)
According to this report, the Careers and Employment industry and Financial Services and Insurance have the highest average CTR above 3.5%. Therefore, we can conclude that the companies operating in these industries are likely to benefit from advertising on Bing in comparison to Google Search.
At the same time, Legal Services, Real Estate, and Auto industries have the lowest CTR on Bing.
This industry benchmark report also provides information about the average cost per click, conversion rate, and cost per action for both Search and Display ads.
Email marketing benchmarks
Wondering about the performance of your email marketing campaigns and newsletters?
Mailchimp, one of the biggest email marketing automation platforms, provides insightful email marketing benchmark statistics by industry. This report contains MailChimp statistics from 2019, covering the whole spectrum of various companies from small businesses to giant corporations.
Highlights:
Top five Industries with the highest Open rate on Mailchimp:
- Government (28.77%)
- Hobbies (27.74%)
- Religion (27.62%)
- Arts and Artists (26.27%)
- Non-profit (25.17%)
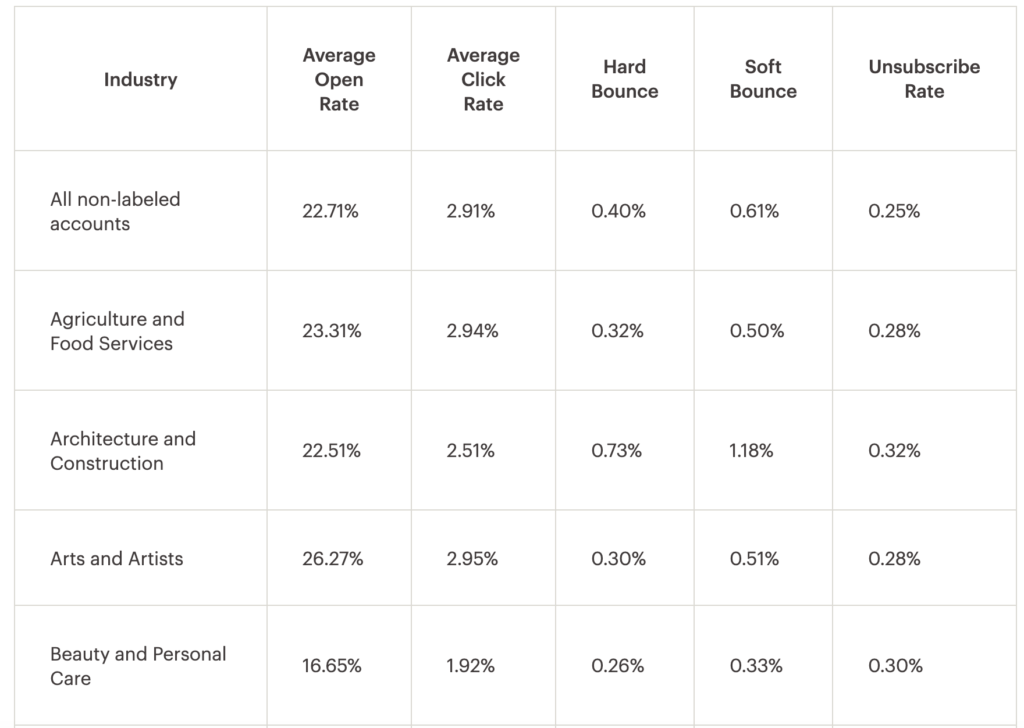
The company analyzed more than 40 industries and shared information about the top five KPIs for each industry: average open rate, average click rate, hard bounce, soft bounce, unsubscribe rate.
According to the report, government-related emails have the highest open rate of 28.77%. In contrast, Vitamin supplements and E-coupons providers have the lowest open rate of about 15%.
In general, the average email open rate for all industries equals 21.33%.
Facebook Ads benchmarks
According to Facebook statistics, more than 7 million advertisers are actively using Facebook to promote their products and services.
Indeed, Facebook ads are heavily used by many companies operating in various industries, from Retail to Financial and Insurance Services. Such popularity is also driven by the fact that the Facebook Advertising channels now include Facebook (the original platform), Instagram, Messenger, and Whatsapp.
How to estimate the effectiveness of your Facebook ads?
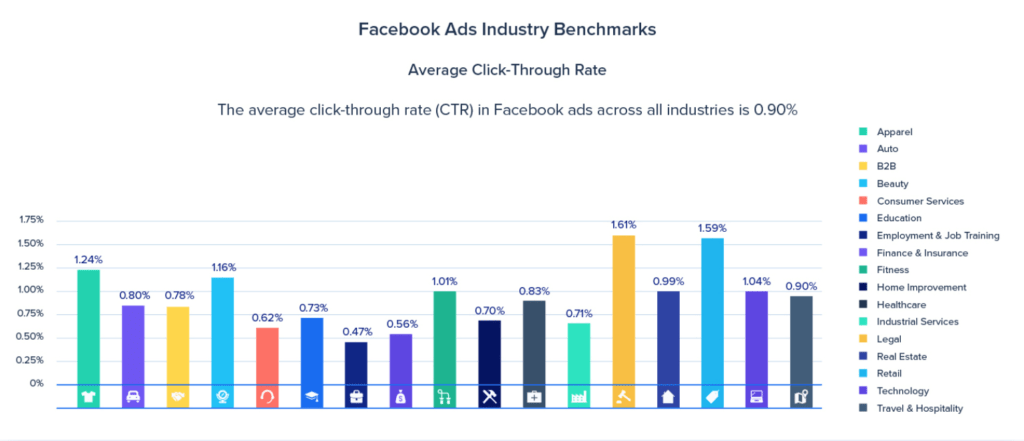
In their marketing benchmark report, Wordstream provides valuable insights into Facebook ads KPI benchmarks. This report is based on the dataset derived from 256 US-based accounts in 2017.
Highlights:
Top five Industries with the highest CTRs on Facebook:
- Legal (1.61%)
- Retail (1.58%)
- Apparel (1.24%)
- Beauty (1.16%)
- Technology (1.04%)
As we can notice, according to this report, the Legal and Retail industries have the highest average CTR in contrast to other industries. Companies that are providing Legal services have the highest CTR of 1.61%. In comparison, Employment and Job Training, Finance and Insurance, and Consumer Services have the lowest average CTR below 0.65%.
In general, the average CTR across all the represented industries equals 0.9%, which is three times lower than the average CTR on Google Search Ads.
Net Promoter Score (NPS)
Last but not least, let us look at the KPI benchmark for the Net Promoter Score. Although more and more companies are starting to apply this concept for measuring customer satisfaction, not everyone keeps in mind that the average value of NPS can vary significantly by industry.
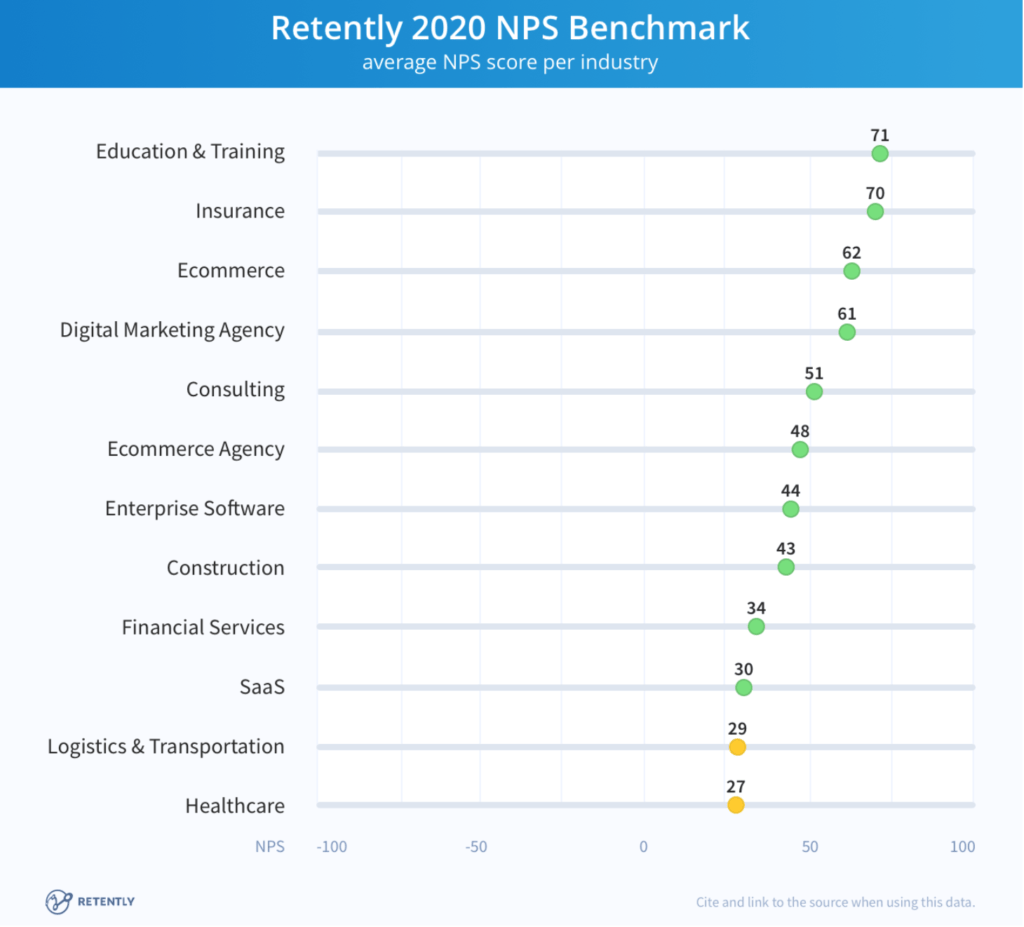
Retently provides a profound overview of the NPS benchmark by industry. This report contains NPS statistics across 12 various industries for 2020.
Highlights:
Top five Industries with the highest NPS:
- Education (71%)
- Insurance (70%)
- Ecommerce (62%)
- Digital marketing agency (61%)
- Consulting (51%)
In general, we can observe how broad the range of the NPS average value is. Depending on the industry, it can vary from 27 to 71%.
According to the report, Education and Insurance industries, on average, have the highest NPS above 70%. In contrast, for the Healthcare, Logistics and Transportation, and SaaS companies, the average NPS is below 30%.
That was it for today!
We hope this compilation will help you to better understand marketing benchmarks for your industry!
Learn more about OKRs setup and Five Problems every marketer has with measuring marketing KPIs in multi-channel campaigns!