It is not a secret that customer relations play a significant role in business. Indeed, the success of your company highly depends on the loyalty of your customers. But how can you make sure that your customers are happy with the service you are providing?
Correlation analysis can help you with that!
What is the true benefit of correlation analysis for marketers?
To evaluate the efficiency of the campaign, marketers usually track key performance indicators (KPIs) and marketing metrics. The main goal of such checks is to maximize the return on investment (ROI) and efficiency while maintaining the quality of customer experience.
Although tracking individual KPIs is of great benefit, the data might further contain valuable information.
Correlation analysis can reveal significant/meaningful relationships between different metrics or groups of metrics. Information about such relationships can provide new insights, and reveal interdependencies. As a result, it helps the company to become more efficient.
But how do you define those relationships and how can you benefit from correlation analysis in marketing?
Let’s simply start by clarifying some of the key terms.

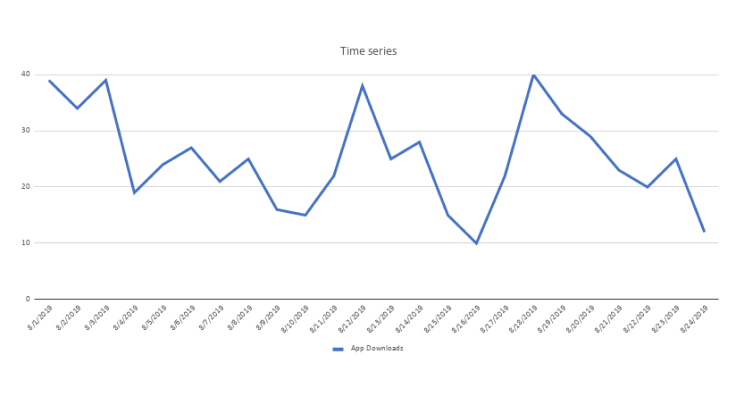
Time series
Generally, in marketing, metrics are variables that mostly evolve over time. In statistics, this approach is called “time-series data”.
Basically, a time series is a series of values recorded over time. In this case, the time intervals should be equal. That is why it is important to set the most suitable time interval/pace for each KPI. Depending on the core values of metrics, the result can be recorded weekly, daily, or even in some cases hourly.
Such time-series analyses will allow you to monitor the most important KPIs and to extract meaningful statistics from the time series data. This can help you to predict future potential results based on previously observed outcomes.
Correlation
The correlation between two metrics can also be defined as the relationship between them.
Basically, in marketing, correlation analysis allows you to reveal the relationship between metrics.
There are several types of correlation coefficients. The most popular and relevant for marketing analysis is the Pearson correlation coefficient. This coefficient is the most suitable for time series data and the one we will refer to going further.
But what exactly does the Pearson correlation coefficient indicate?
In statistics, the Pearson correlation coefficient is a measure of the linear relationship between two variables. In our case, those two variables are two marketing metrics. The correlation coefficient ranges from +1 to −1.
Let’s find out how to interpret the value.
Depending on the value, three types of correlations can be defined:
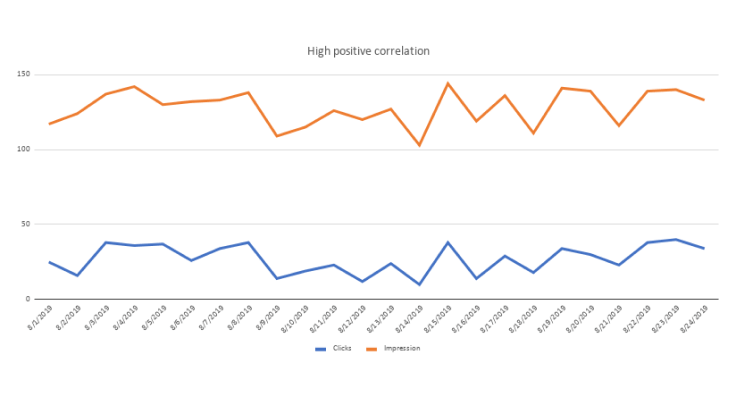
Positive correlation
A correlation coefficient of 1 means that there is a perfect positive linear association between the two variables. This means that if one metric increases, the other metric increases too. The vice versa is true: the decrease of one metric signifies the decrease for another one too.
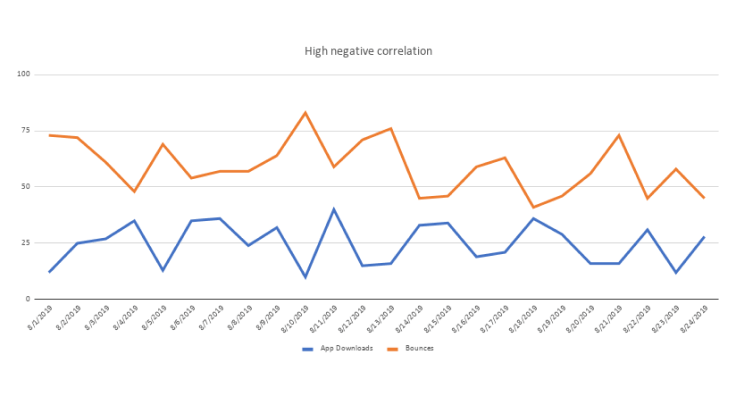
Negative correlation (anti-correlation)
A correlation coefficient of -1 means that there is a perfect negative linear association between the two variables. When one metric increases, the other metric decreases; when it decreases, the other one increases.
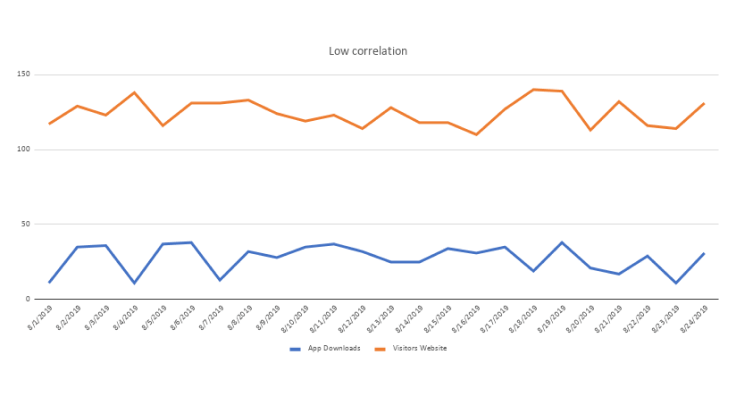
No correlation
A value of 0 implies that there is no linear relationship between the two variables.
Correlation analysis can provide information about different marketing metrics and their relationships. As a result, you can get more insight into your marketing performance.
The correlation analysis can be conducted in different ways.
As an example, the Nexoya’s platform reveals associations among the metrics by showing the correlation coefficients between the pairs of metrics.
Knowing the relevant correlations between the different pairs of marketing metrics can help you to:
1. Formulate and test new hypotheses;
2. Uncover potential causality (A/B testing);
3. Become more proactive and stay updated regarding the efficiency of your marketing campaign;
4. Use the gained insights to improve marketing performance.
As a result, correlation analysis can help you to monitor and test your customer’s reaction to different marketing tactics.
Correlation analysis can help you to better understand your customers.
Stay curious and be creative/proactive!
We are glad to share with you the tips and tricks you can use to improve your marketing performance!
Learn how to leverage data-driven decisions in marketing
and make your data ready for AI implementation!