
Platform Tour: navigation and the main tabs
This article walks you through the platform, so you know what each area is for and where to find things. Nexoya Starter uses the same interface as the full Nexoya platform. Features that are part of Nexoya Premium are visible but marked as “Available on Premium.”
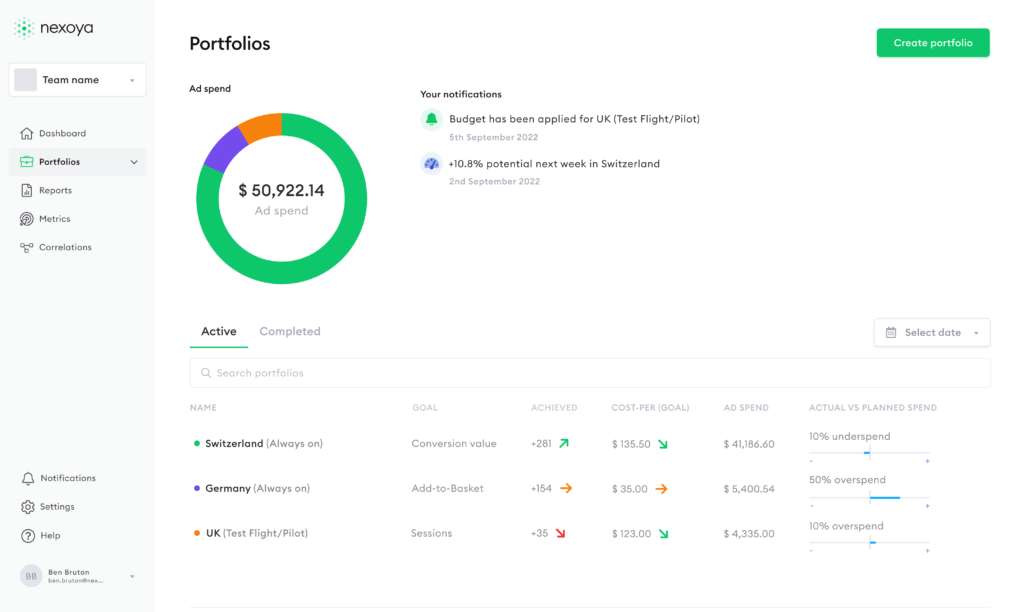
The portfolio overview
After logging in, you land on the portfolio overview. It lists all portfolios you have created, with their name, duration, and budget at a glance. From here, you create new portfolios via the “Create Portfolio” button or click any portfolio to open it.
Everything in Nexoya happens inside a portfolio: a group of campaigns from different channels that you monitor and manage together under a shared budget. When you open a portfolio, you see a set of tabs. The rest of this article explains each tab.
Inside a portfolio
When you open a portfolio, the header shows its key facts: the duration, the portfolio type, the portfolio target (your Northstar KPI), and how much of the planned budget has been spent. Below the header you find seven tabs: Performance, Optimize, Validation, Budget, Simulations, Content, and Portfolio settings. The rest of this article explains each one.
Performance tab
The Performance tab is where you will spend most of your time. It gives you a cross-channel picture of how all campaigns in your portfolio are performing, structured top to bottom: summary KPIs at the top, then the marketing funnel, the trend chart, and the campaign table.
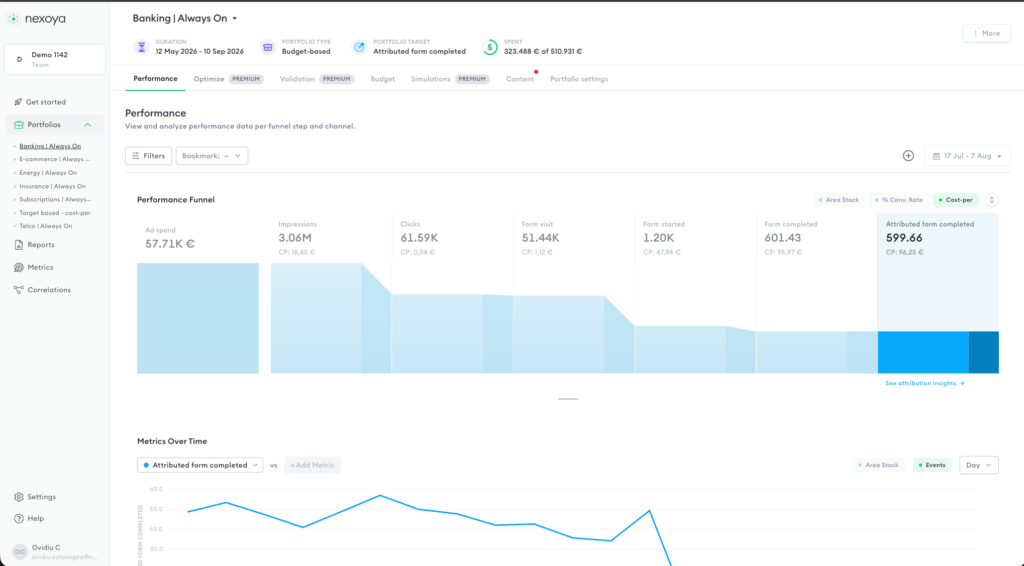
The funnel: Your funnel stages, from Impressions through Clicks, Sessions, and Conversions, are displayed side by side. Hover over any stage to see the exact value and the conversion rate from the previous stage, which makes it easy to spot where volume drops off. Clicking a funnel step selects that metric in the chart below. The funnel can be expanded or collapsed with the arrows next to it, and conversion rates and cost-per metrics can be switched on and off.
The chart: The performance chart shows your metrics over time and supports up to three metrics on a shared timeline. A useful combination is your main KPI, Ad Spend, and one volume metric such as Clicks. This shows immediately whether a performance spike comes from a budget increase or a real efficiency improvement. Data can be aggregated by day, week, month, or quarter.
Filters: Click the “Filters” button to narrow the view by channel, campaign title, ad spend range, content rule, or label. All filters apply to the funnel, chart, and table at the same time, so every section always shows the same slice of data. Filter combinations can be saved as presets and shared with your team.
Compare time periods: Click the plus sign next to the date picker to compare different time periods – last month, last week, or a custom range of your choice. This also lets you monitor how performance has changed for your selected filters: pick a comparison date range, and the chart shows the uplift or change as a percentage.
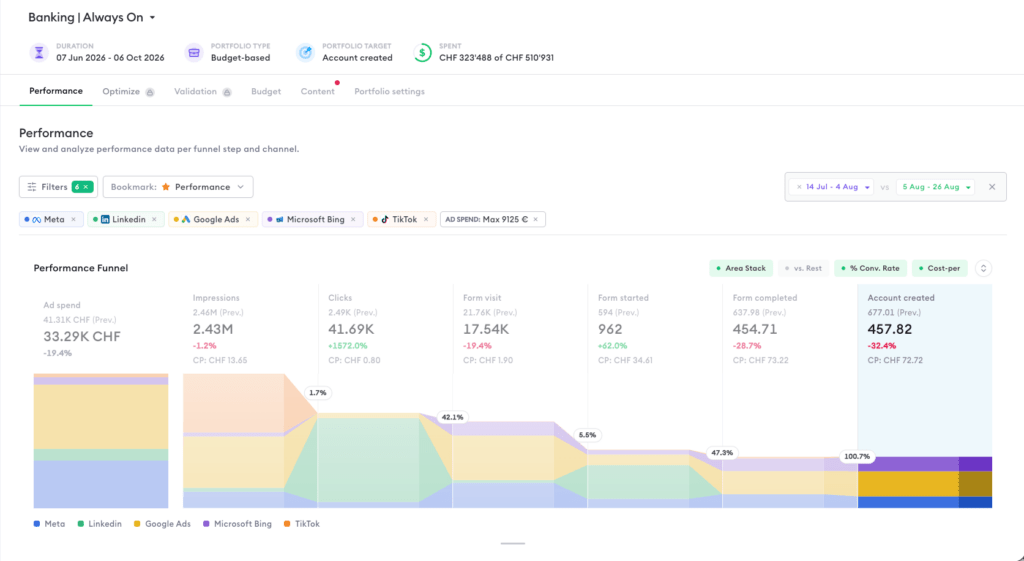
The campaign table: The table at the bottom lists every campaign with its metrics. Columns can be selected, reordered, and pinned, and campaigns can be grouped by channel or label. Click any column header to sort. Table layouts are saved between sessions and can be shared with your team.
Optimize tab
The Optimize tab is part of Nexoya Premium. This is where optimization proposals are launched and managed. On Premium, Nexoya’s AI analyzes your portfolio and generates a budget proposal for the upcoming period: for every campaign, it compares the current daily budget with a proposed daily budget, based on predicted performance, saturation curves, and seasonality. The proposal can be reviewed by channel, label, or individual campaign, and then applied to the connected channels or discarded. Past proposals stay available under “Applied” and “Discarded.”
Validation tab
The Budget tab is where you plan and track your portfolio budget. It has two parts.
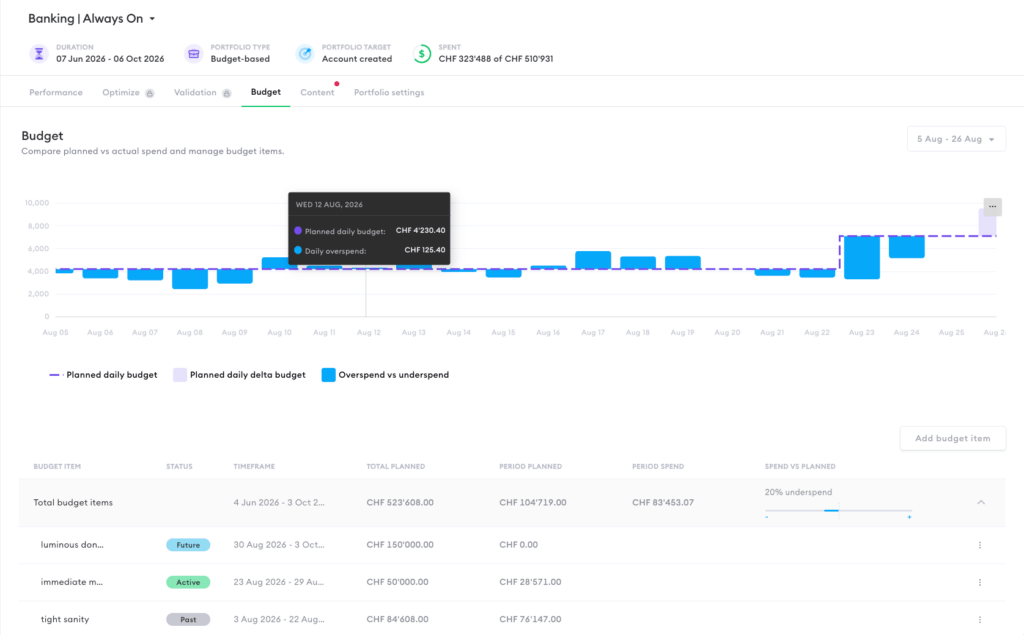
The chart compares your planned daily budget (dashed line) against actual spend. The bars show where the portfolio overspent or underspent relative to plan on each day.
The budget items table below lists your budget items: each item defines how much budget is available for a specific timeframe, with a status of Past, Active, or Future. The summary row shows total planned budget, spend in the selected period, and the overall deviation from plan. New items are created with the “Add budget item” button, and future items can be edited or deleted. See Managing your budget for a step-by-step guide.
Simulation tab
The Simulations feature is part of Nexoya Premium. It lets you simulate different budget levels for the next planning cycle before committing to them. Moving the budget slider shows the predicted outcome per scenario across all funnel steps, plotted on a curve that makes saturation visible: the point where additional budget stops paying off. Scenarios can be compared side by side, come with a reliability rating, and can be applied directly to the portfolio.
Content tab
The Content tab is the inventory of your portfolio. It shows every campaign and ad-set that is part of the portfolio (Nexoya calls these “contents”), how each one entered the portfolio, and how its data connects to your funnel.
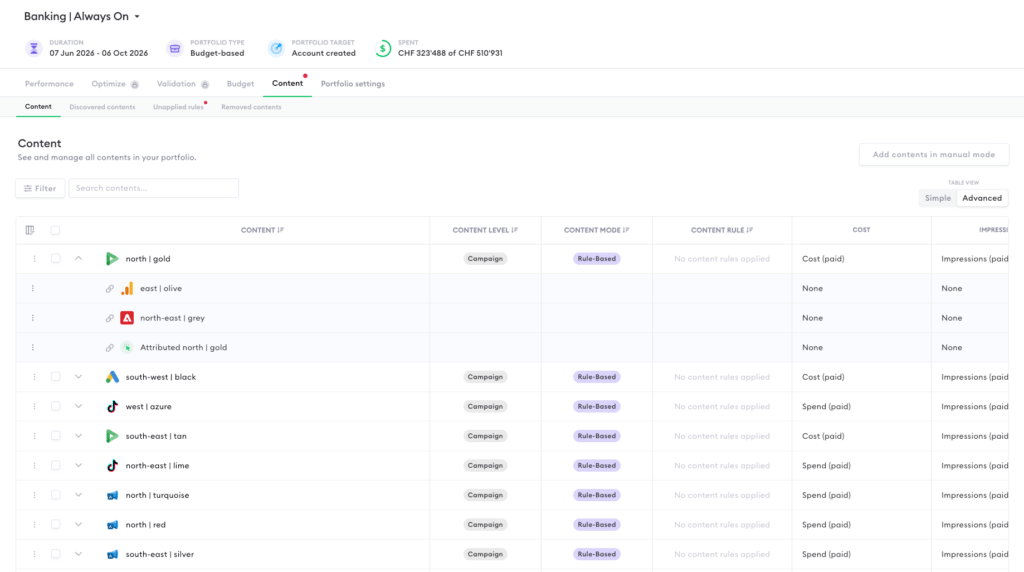
For each content you see the channel it comes from, its level (campaign or ad-set), its mode (“Rule-Based” means a content rule added it automatically, the recommended approach; contents can also be added manually), and its labels.
The sub-tabs cover the content lifecycle. “Discovered contents” lists newly detected campaigns from your channels that are waiting to be added. “Unapplied rules” shows rule matches that have not been applied yet. “Removed contents” is the archive of contents taken out of the portfolio.
See Mapping campaigns into your funnel and Working with labels for the details.
The table also contains an “Attribution Rule” column. On Premium, attribution rules group contents by channel and role and assign attributed metrics to each group; the column shows which rule a content matches. Since attribution is not part of Nexoya Starter, it shows “No attribution rules applied” for every content. This is expected and not a setup problem.
Portfolio Setting tab
The Portfolio settings tab holds your portfolio configuration, organized in sub-tabs:
General covers the portfolio name and duration, and the label definitions for this portfolio. Labels are defined here and assigned to individual contents in the Content tab. The General section also contains optimization-related settings such as the budget reallocation risk level and budget apply mode; these belong to Nexoya Premium.
Funnel is where your funnel steps and portfolio target are defined. The funnel configured here determines what you see in the Performance tab.
Content rules is where you set up the conditions – like naming patterns – that automatically detect matching campaigns and surface them as discovered content. Note: campaigns are never added to your portfolio without a manual check. Once you review and add them, the rule maps them to your portfolio automatically. See Mapping campaigns into your funnel.
Attribution appears when attribution feature is active on a portfolio (a Premium feature). It holds attribution rules: filters that group contents by channel and title conditions and assign attribution metrics to the whole group in bulk. The rule a content matches is shown in the last column of the Content tab.
Events lets you register moments that influence performance, such as product launches, sales periods, price changes, or tracking issues, each with a timeframe, category, and impact size. On Premium, the AI accounts for these events in its predictions, so unusual periods don’t distort the optimization.
Where to go next
Ready to get started? Begin with Connecting your data, then Setting up your portfolio.
Can’t find the answer to your question?
No problem, you can submit your question to us here.
Contact