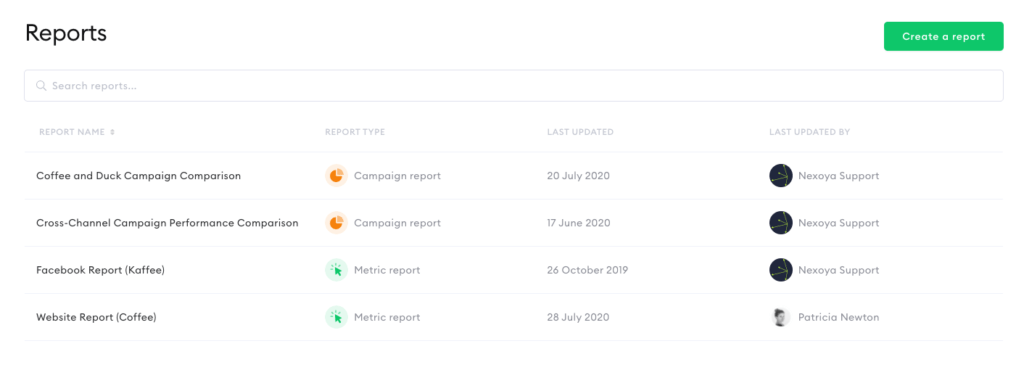
In this section, you can find all the reports which you or your team members have created.
In the overview page of the report section you can see the information about each report: report name, type (campaign or metric), the last day the report was updated, and the last person who modified it.
How to navigate through the Report section
You can explore and gain further insights about a specific report by simply clicking on it.
What are the different report types?
As you can see there are two types of reports in Nexoya: Metric Report and Campaign Report.
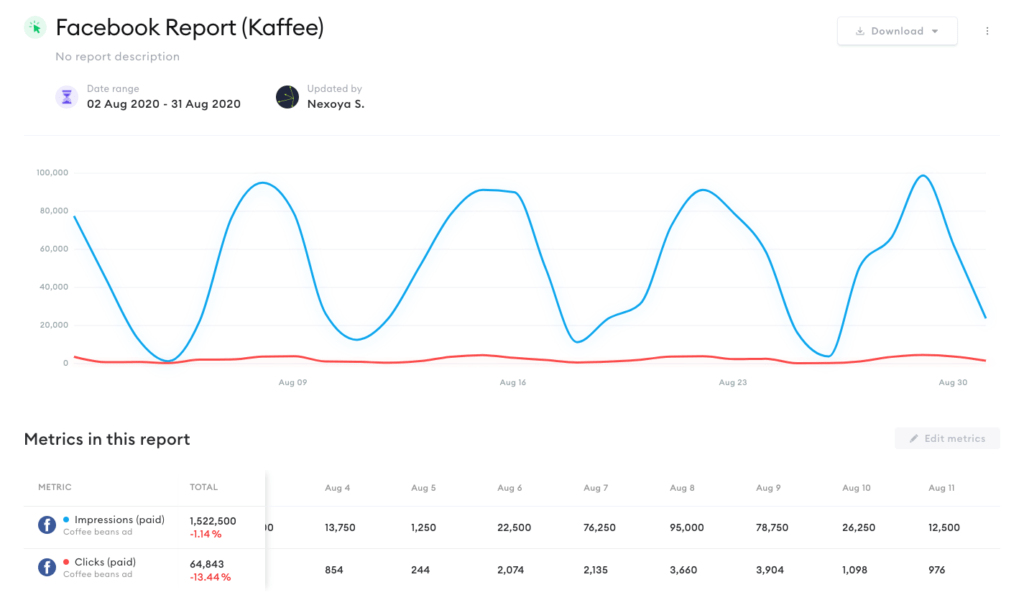
The Metric Report shows the selected metrics within a timeline chart. The usage varies from monthly recurring reports to one-time marketing activities, which are a more in-depth analysis.
This report is also used for metrics comparison.
The report helps you to visualize the behavior of the selected metrics, presented in a timeline chart. In addition, you will see an automatically generated table with the day-to-day analysis of the metric activity.
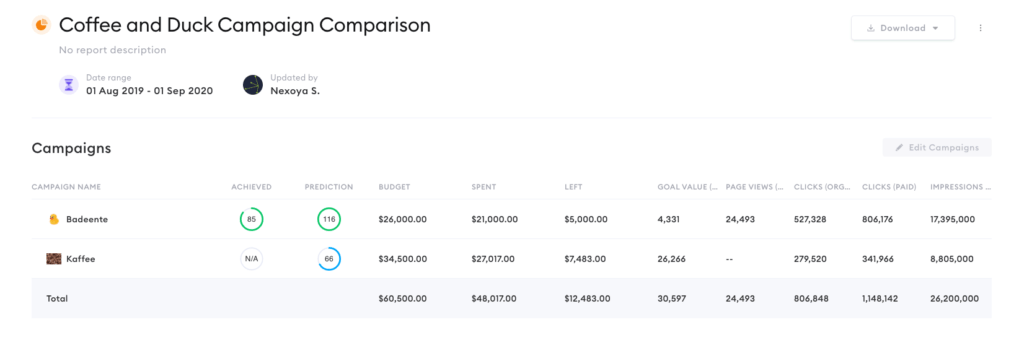
The Campaign Report is used for providing an overview of overall campaign performance. In this view, you can see more details about all the metrics contained in the campaign. It can be the percentage of the goal achieved, campaign prediction, amount of money spent, clicks, impressions, CPC, views, etc.
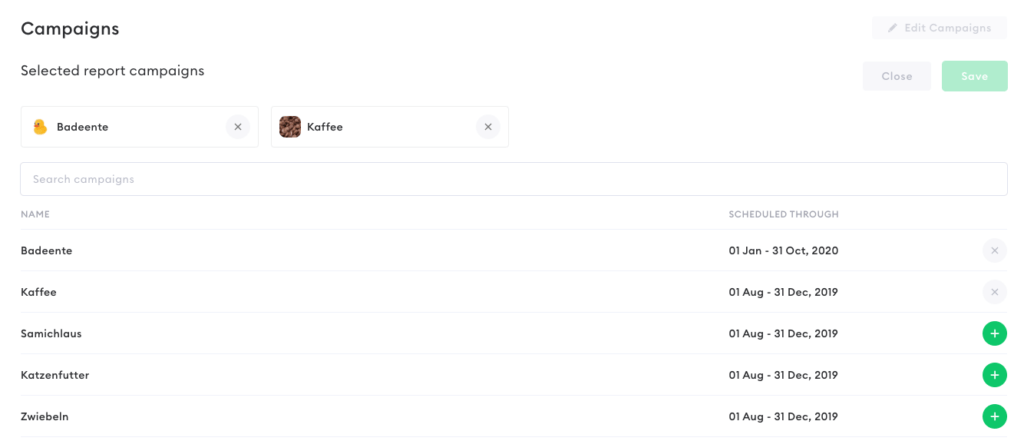
This type of report is also used for the comparison of various campaigns. In order to add or delete a campaign in the existing report, click on the “Edit campaigns” button and simply select the campaigns that you want to analyze or compare. You can easily modify reports at any time. Make sure you save your changes.
How to create reports in Nexoya
How to create a Metrics Report
- Navigate to the Report section and click the “Create a Report” button
- Choose Metrics Report
- Select the metrics you want to analyze
- Name your report and provide a description if necessary
- Provide the date range
- Save the report
- Start analyzing the data
- Download the report if necessary (as pdf or excel)
How to create a Campaigns Report
- Navigate to the Report section and click the “Create a report” button
- Choose the type of your report: Campaigns
- Select the campaigns you want to analyze
- Name your report and provide a description if necessary
- After successfully saving the report, you can now compare the campaigns with each other
- Download the report if necessary (as pdf or excel)
After the report is finalized you can easily download it as a Pdf or Excel using the “Download” button.
You can also edit or delete reports by clicking on the three dots located next to the “Download” button.
You can also create reports directly in the Metrics section.
Check out our short explanation video 🙂