
Exciting news is on the horizon – we’ve made it even easier to access these powerful features in the redesigned Performance View. These capabilities are designed to provide more transparency, data insights, and a seamless overview of your cross-channel campaign performance.
What’s New?
Group Filter 📑
Streamline your reports!
Segment and view data based on specific criteria like funnel stages, goals, countries, or product categories. You have the power to define your groups based on the weightage assigned to your campaigns. If you wish to learn more about this feature or tweak your current grouping, reach out to your customer success manager.
With the Group Filter, you can:
- Quickly assess the performance of each group.
- Contrast and compare group performances.
- Get comprehensive insights into KPIs per group.
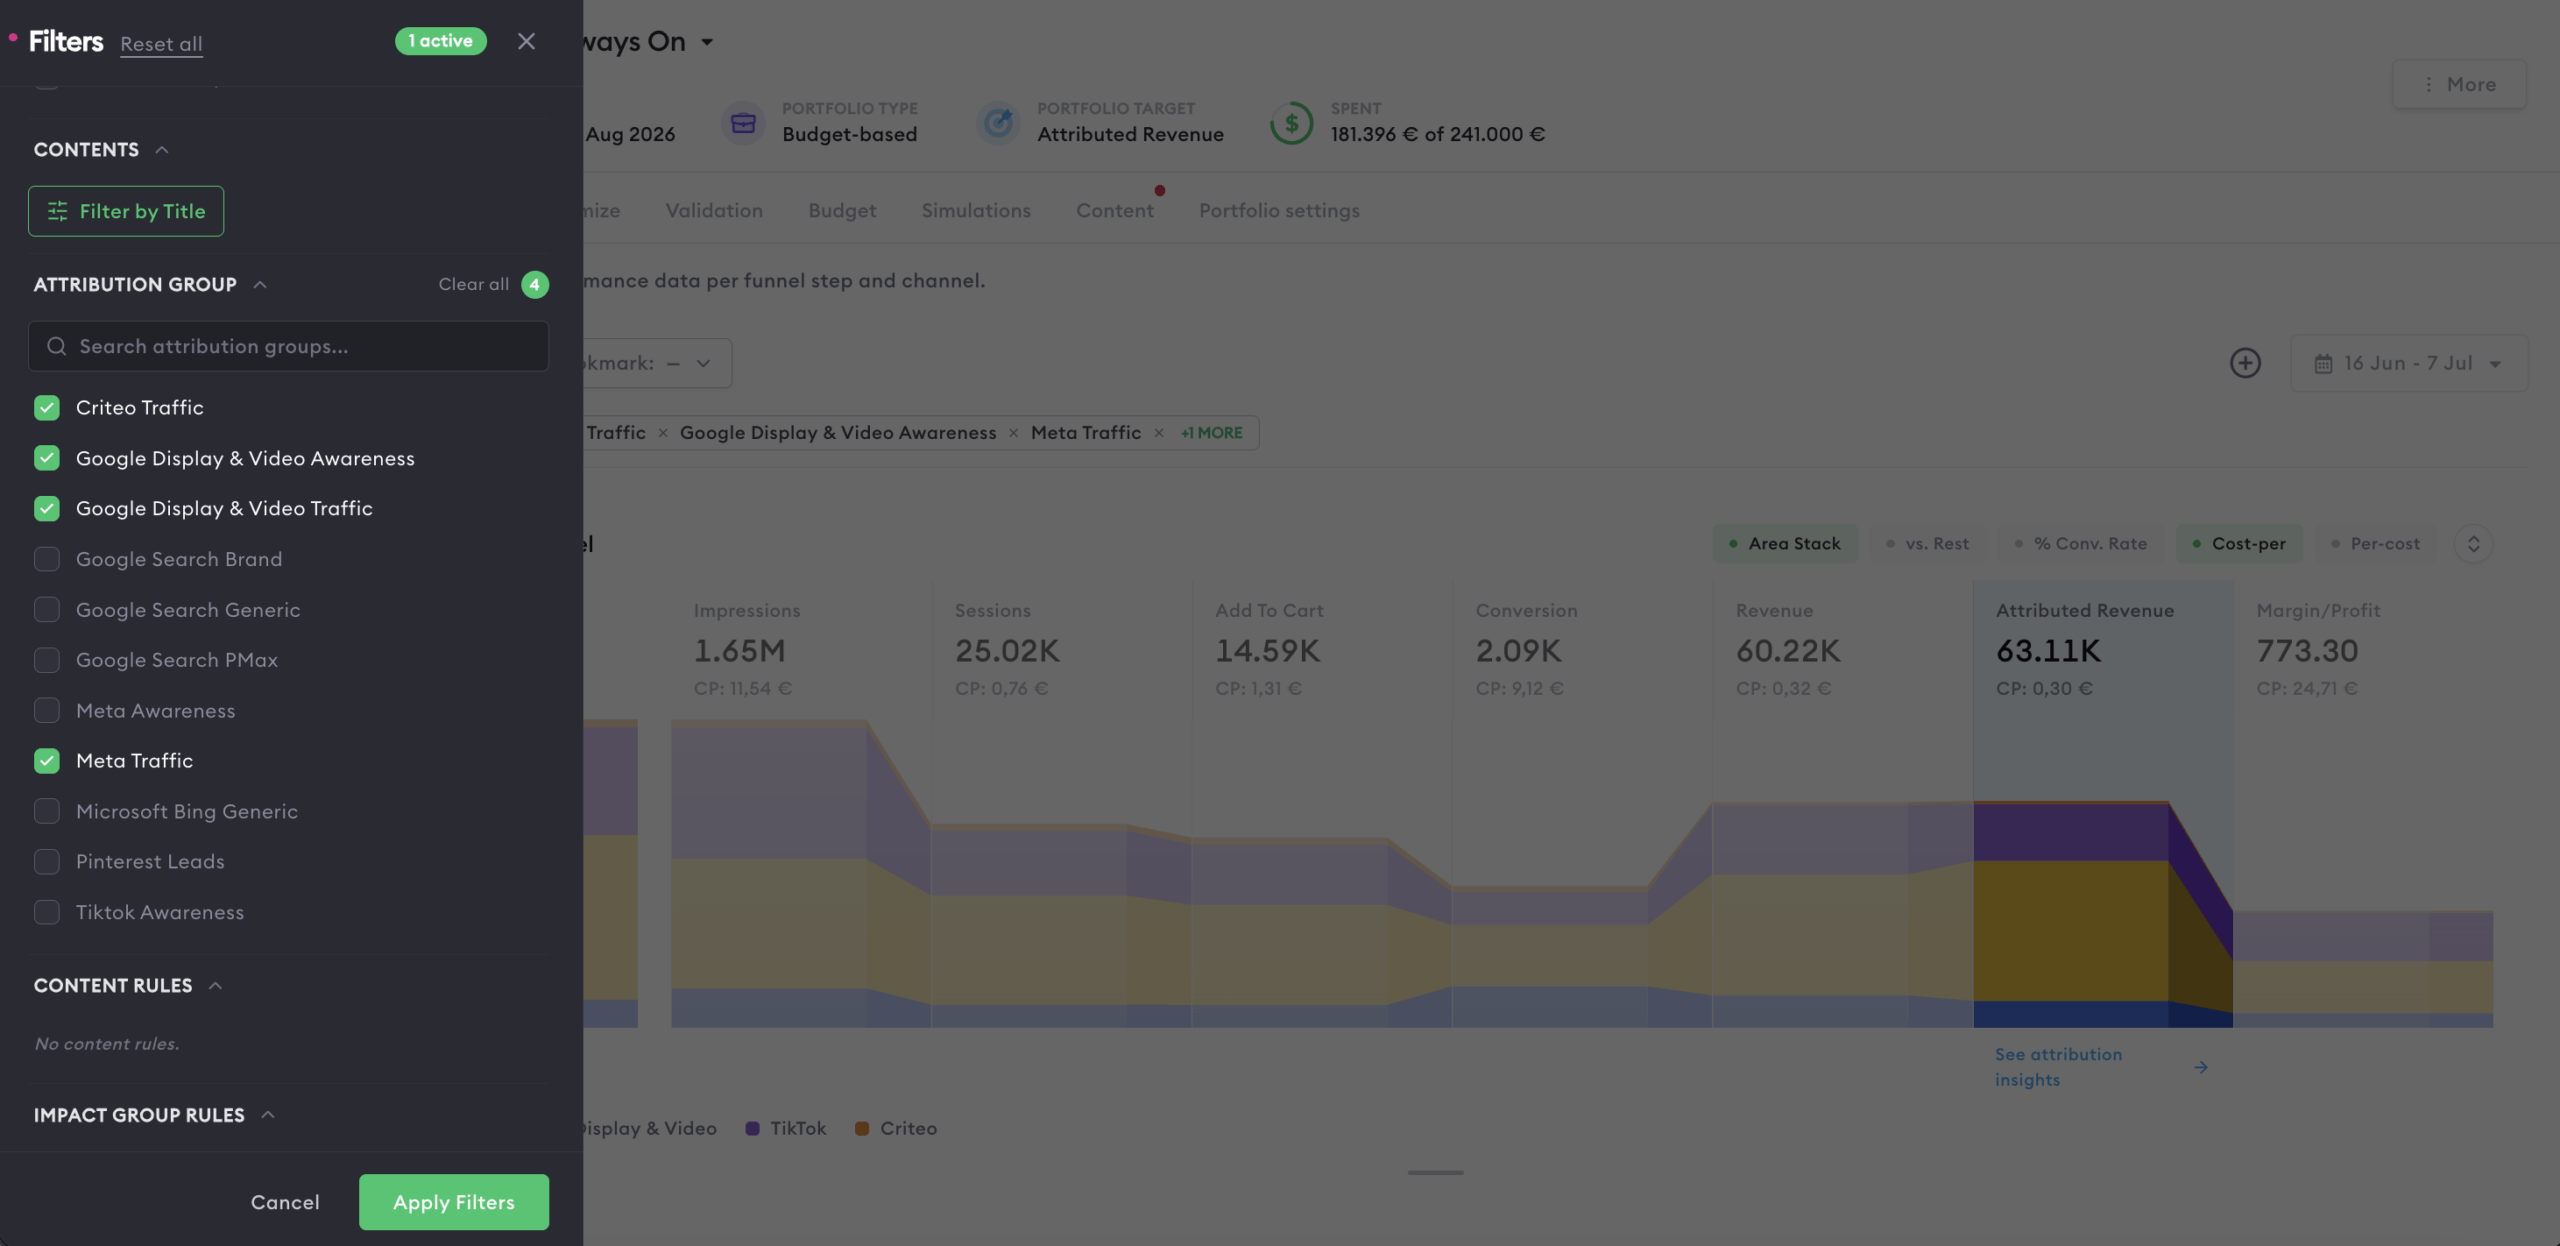
Click the “Filters” button at the top of the Performance View. Here you can apply multiple filter dimensions simultaneously (channel, optimization state, attribution group, ad spend, labels, and more). All filters apply in real time across your funnel, chart, and table. Save your filter configurations and share them with your team.
Stacked View 📊
Want a detailed daily performance breakdown within a group perspective? Say hello to our stacked area charts. This visualization not only gives you a clearer understanding of performance metrics but also allows you to:
- Evaluate the impact of your initiatives.
- Estimate the efficiency of your activities.
- Utilize this view for other filters, such as channels.
- And it’s simply visually stunning!
To activate the Stacked View simply by selecting the ‘Area Stack ‘option.

Take a moment to explore these new capabilities in Nexoya!