Planning a big campaign or a new product launch?
Today’s marketers are navigating a rapidly evolving landscape. From planned promotional pushes and seasonal sales to unexpected external disruptions like macroeconomic shifts or technical hiccups, there are countless factors that can affect campaign performance.
The problem? These events often skew your results.
That’s where the Events feature comes in. This feature lets you add internal or external events that could impact your performance. Whether it’s a major promotion, a brand awareness push, a product launch, or even an external factor like a competitor’s campaign or a public holiday – Nexoya can now take it all into account to enhance prediction accuracy.
Key Benefits of the Events Feature
1. Add business-specific events as model inputs
Every business is unique. You can define which events matter, how big the impact is, and which campaigns are affected, making future predictions more accurate—leading to smarter budget allocation and better optimization results.
2. Improve prediction quality with richer context
The model learns from your past events and uses that knowledge to improve predictions for future, similar scenarios. The more you use it, the smarter it gets.
3. Smarter simulations and pacing proposals
Incorporating key events helps Nexoya deliver more accurate simulations and pacing recommendations – enabling smarter, data-driven budget planning that reflects actual dynamics.
Seven Event Types
You can select from seven event categories for your events:
- Promotion & Discounts (small or large)
E.g. price drops, limited-time offers, loyalty or low-funnel pushes. - Product Launch (small or large)
E.g. new product launches, feature rollouts, or major category launches. - Brand Awareness (small or large)
E.g. TV campaigns, offline activations, or broader awareness pushes. - Price increase (small or large)
E.g. price increases and their potential impact on behaviour or conversions. - Positive External Effects (small or large)
- E.g. holidays, competitor outages, favourable macroeconomic conditions.
- Negative External Effects
E.g. competitor promotions, global crises, or regulatory challenges. - Tracking Issues
E.g. gaps in tracking or reporting disruptions—so they don’t skew your optimization.
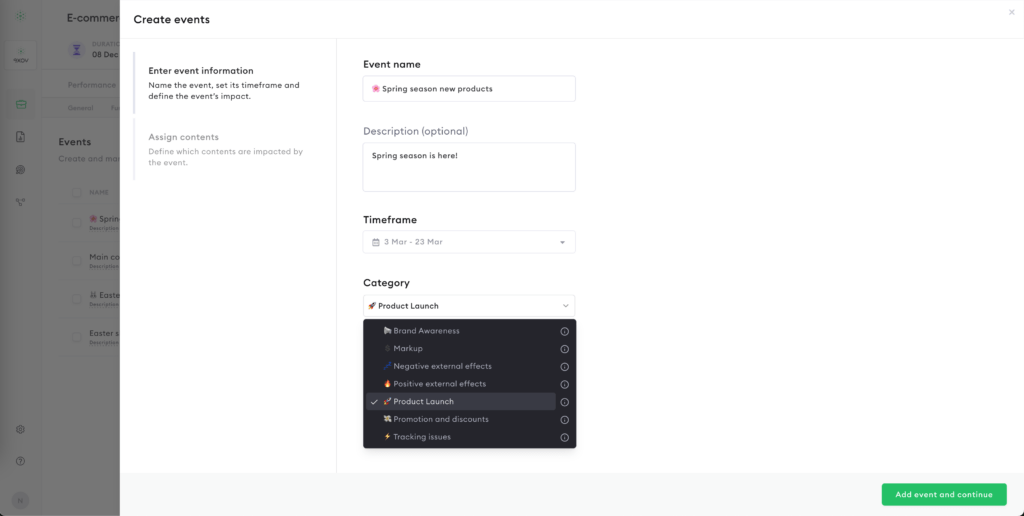
💡 For most categories, you can define the impact size (small or large) to help the algorithm interpret the scale of each event more accurately.
The impact level isn’t based on a fixed scale—it’s based on your own estimation. What matters most is consistency. If you expect the event to have a relatively minor effect, choose small. If you believe it will significantly influence performance, select large. This helps the model understand the relative weight of each event over time.
How Does It Work?
At the heart of this feature lies Nexoya’s AI-driven algorithm, which is continuously learning from your historical performance data. The more events (=context) you add, the smarter it gets. It will start recognizing patterns over time and understanding how different types of events impact your campaign results.
Simply put: the more events you add to the Nexoya platform the more accurate and tailored your predictions become.
Here’s how it works step by step:
1. Learning from the Past
Every time you add an event, be it a product launch, promotion, or other event, Nexoya starts learning how that specific category of event impacted your performance. It analyzes key performance metrics across all relevant adsets, campaigns and channels, creating a data-rich context to better predict behaviour for future predictions.
Does it mean that you need to provide information about past events as well?
Yes, adding past events is essential. The more historical data you provide, the better the algorithm can learn and recognize patterns, leading to more accurate predictions. Think of it as giving the model valuable context to work with.
👉 Important: Make sure that the campaigns that were active during those past events are also added to your portfolio, so the model can access the relevant performance data.
2. Transferring Insights to the Future
Once the algorithm has learned from past events, it applies that knowledge to similar upcoming ones (events from the same category). This transfer of learnings ensures that predictions for future campaigns take into account how similar situations have influenced your performance before.
For example:
- Did your last big discount campaign result in a spike in conversions?
- Did a competitor promotion last summer lead to a drop in your traffic?
Now, when you plan your next similar campaign, Nexoya already has that context—and can predict performance more accurately.
3. How the Algorithm Learns
Here’s what Nexoya’s algorithm looks at to generate learnings:
Event Category: Compares past and future events of the same category (e.g. Product Launch -> Product Launch).
Performance Metric: Analyzes each metric/KPI individually (e.g. “Clicks” learning from “Clicks”).
Cross-Campaign Insights: Learns from historical data across multiple campaigns—so even new campaigns benefit from the insights gained from past events.
💡 Pro tip: To maximize prediction accuracy, make sure you consistently log past events. The more complete your event history is, the more accurately Nexoya can model future outcomes.
How Can I Add My Events?
Adding events is easy, and you have two options: create them manually or upload a CSV file.
Note: You can have multiple events at the same time – overlapping events are supported.
How to add new events:
- Go to your Portfolio
- Open the Portfolio settings tab
- Select the Events sub-tab
- Click “Create Event”
From here, choose how you want to proceed:
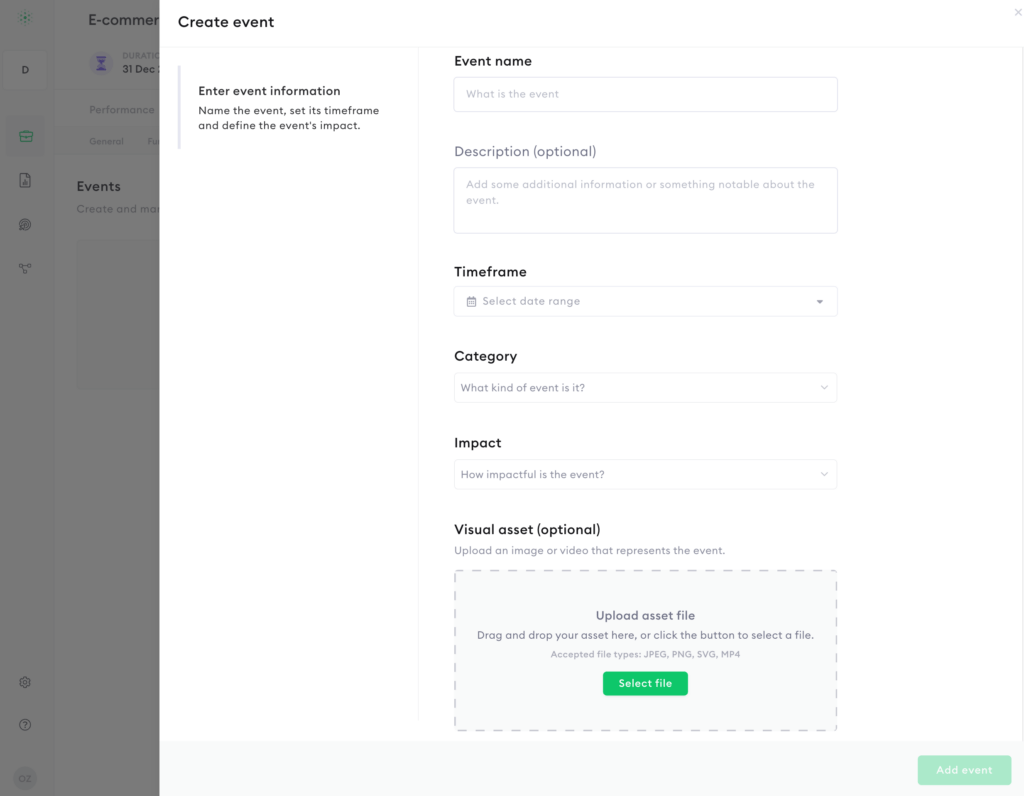
Option 1: Add event details manually (best for single events)
Fill in the event details:
- Name (must be unique per portfolio)
- Description (optional)
- Timeframe: Start and end date
- Event category: select one of the 7 categories
- Estimated impact (small or large)
- Select what campaigns are impacted: you can either assign certain campaigns or the entire portfolio
- Upload a visual asset (optional): You can upload an image or video that represents the event—such as a campaign visual or promotional video—making it easier for you and your team to recall and contextualize the event later.
Option 2: Bulk Upload via CSV (best for multiple events)
- Prepare your CSV file with the following columns:
- Event name
- Description (optional)
- Start date and end date
- Event category:
- PROMOTION_AND_DISCOUNTS
- PRODUCT_LAUNCH
- BRAND_AWARENESS
- PRICE_INCREASE
- POSITIVE_EXTERNAL_EFFECTS
- NEGATIVE_EXTERNAL_EFFECTS
- TRACKING_ISSUE
- Impact level:
- SMALL
- LARGE
2. Make sure there are no extra columns, special characters, or missing fields
3. Upload the file via the Events tab in your portfolio settings
Need help? You can download a ready-made template directly from the app—it’s quick and easy to fill in!
Where Can I See My Events in the App?
Your logged events are visible in multiple places: Performance, Optimization & Simulation tabs:
Performance tab
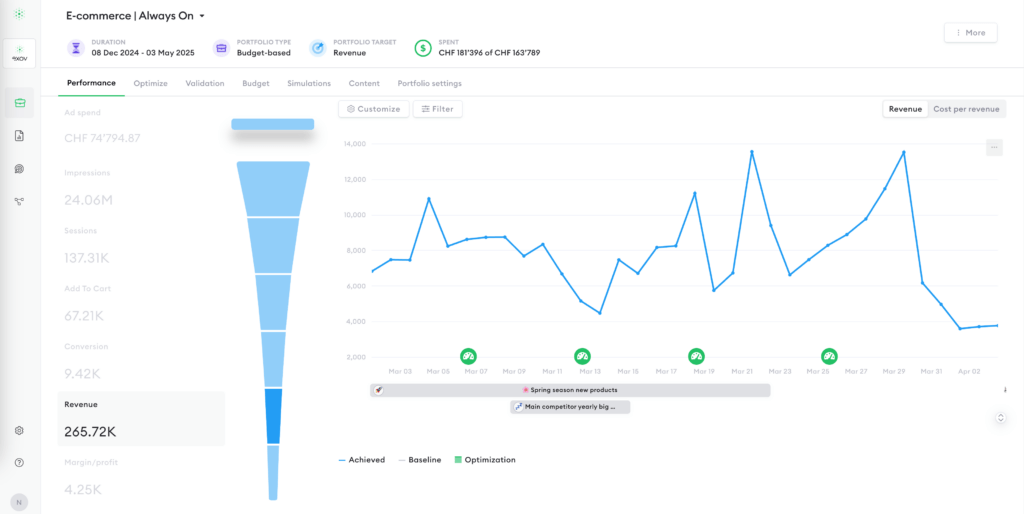
Go to the Performance tab, click on “Customize” and choose “Show events”. In this view, events appear as visual widgets below the graphs, clearly marking their active timeframes.
You can also expand and collapse the view using the expander on the right side.
Optimize tab
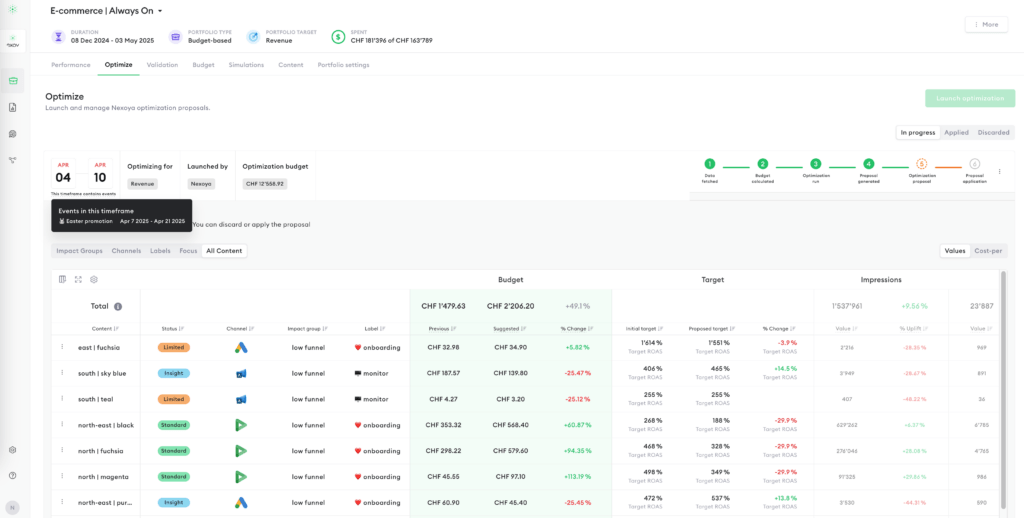
Head to the Optimize tab. If there are any active events during the selected timeframe, you’ll see them listed below—giving you visibility into which events are being considered in the current optimization.
Even if an event is deleted afterward, it will still appear here, as Nexoya displays all events that were present at the time the optimization was executed. This ensures full transparency and consistency in your results.
Simulation tab
Go to the Simulation tab and select any performance metric on the left (e.g., Impressions, Add to Cart, etc.). Then, simply activate the “Show Events” toggle to display all events occurring within the selected timeframe.
Just like in the Optimize tab, events will appear here even if they were deleted afterward—you’ll always see the events that were present at the time the simulation was executed, ensuring full transparency and context.
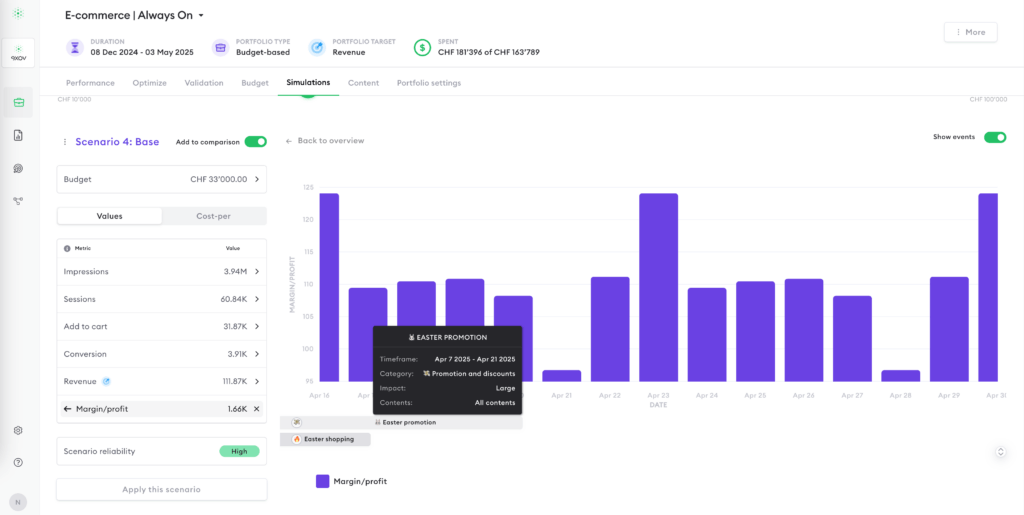
Simply put, the Events feature allows you to always clearly see what active events are currently happening and considered by the algorithm.
FAQ
Is it possible to see the impact of an event on performance?
No, the impact is used internally by the model and not displayed directly.
Can I create a custom event category?
No, we intentionally limit categories to ensure strong transfer learning.
How do Events relate to Google Trends or seasonal cycles?
They all work together as model inputs to improve prediction accuracy.
What should I model as an “Event”?
- Easter: Yes
- Holidays: Yes
- Seasonal patterns (e.g., spring vs. summer): No – these are already handled by seasonality modeling
From a machine learning perspective, how does the selected event category affect the prediction?
The chosen category does not directly impact the prediction itself. It defines how learnings are transferred between past and future events of the same category (see explanation above).
If I have different types of promotions (e.g., 20% vs. 50%), can the model distinguish between them and ensure that the historical impact of a 50% promotion is only considered when a similar 50% promotion occurs again?
You need to classify each promotion consistently by assigning it to either the small or large impact category. The model then uses internal weighting to determine the strength of the learning transfer. For example, a small promotion will have a weaker influence on a large promotion than a large promotion would have on another large promotion.
